Reinsurance Group (RGA) Q1 Earnings Beat on Higher Premiums
Reinsurance Group of America, Incorporated RGA reported first-quarter 2023 adjusted operating earnings of $5.16 per share, which beat the Zacks Consensus Estimate by 53%. The bottom line, however, increased 23.4% from the year-ago quarter.
Net foreign currency fluctuations had an adverse effect of 18 cents per share on adjusted operating income year over year.
Reinsurance Group witnessed solid performance in the U.S. and Latin America and Canada segments, offset by soft results in Asia/Pacific and Europe, Middle East and Africa.
Reinsurance Group of America, Incorporated Price, Consensus and EPS Surprise
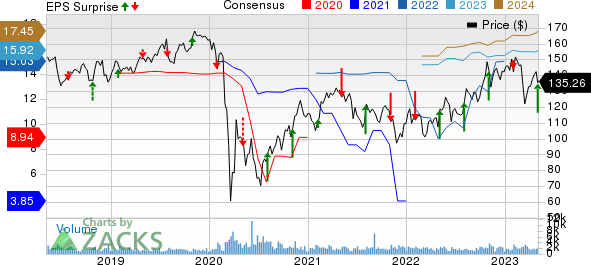
Reinsurance Group of America, Incorporated price-consensus-eps-surprise-chart | Reinsurance Group of America, Incorporated Quote
Reinsurance Group's operating revenues of $4.3 billion beat the Zacks Consensus Estimate by 2.4%. The top line also improved 6.7% year over year driven by higher net premiums and investment income and net of related expenses.
Net premiums of $3.4 billion rose 7.3% year over year. Investment income and net of related expenses increased 5.6% from the prior-year quarter to $856 million. The average investment yield was down 58 basis points (bps) to 4.71% due to lower variable investment income, partially offset by higher yields.
Total benefits and expenses at Reinsurance Group increased 6.8% year over year to $3.9 billion on higher claims and other policy benefits, interest credited, other operating expenses, interest expense and collateral finance and securitization expense.
Quarterly Segment Update
U.S. and Latin America: Total pre-tax adjusted operating income was $227 million in the quarter, increased 55.4% from the year-ago quarter.
The Traditional segment reported a pre-tax adjusted operating income of $122 million, more than doubled year over year. Net premiums rose 4.8% from the year-ago quarter to $1.6 billion.
The Asset Intensive segment’s pre-tax adjusted operating income improved 10.5% to $84 million. The results reflected favorable investment spreads, including higher yields on floating rate securities.
The Capital Solutions business reported pre-tax adjusted operating income of $21 million, down 16% year over year.
Canada: Total pre-tax adjusted operating income increased 50% to $36 million.
The Traditional segment’s pre-tax adjusted operating income increased 93.3% year over year to $29 million. Net premiums decreased 2.9% to $295 million. Foreign currency exchange rates had an adverse effect on net premiums of $20 million.
The Financial Solutions segment’s pre-tax adjusted operating income increased 11.1% year over year to $10 million, attributable to favorable longevity experience.
Europe, Middle East and Africa: Total pre-tax adjusted operating income was $96 million, which increased 1% year over year.
Pre-tax adjusted operating income of the traditional segment decreased 20.6% to $27 million year over year, reflecting moderately unfavorable experience, primarily due to estimated claims related to the earthquake in Turkey. Premiums decreased 2.8% to $438 million in the quarter. Foreign currency exchange rates had an adverse effect on net premiums of $41 million.
The Financial Solutions segment delivered pre-tax adjusted operating income of $69 million, up 13.1% from the year-ago quarter, reflecting favorable longevity experience.
Asia/Pacific: Total pre-tax adjusted operating income of $119 million decreased 7.7% from the prior-year quarter.
The Traditional segment’s pre-tax adjusted operating income of $79 million was down 26.8%. Foreign currency exchange rates had an adverse effect of $2 million on pre-tax adjusted operating income. Premiums increased 1.8% to $662 million. Foreign currency exchange rates had an adverse effect on net premiums of $33 million.
The Financial Solutions segment’s pre-tax adjusted operating income increased 90.5% to $40 million. Net premiums increased 48.8% to $64 million. Results reflected contributions from recent and strong new business growth.
Corporate and Other: Pre-tax adjusted operating loss was $25 million, wider than the year-ago loss of $18 million in the prior-year period.
Financial Update
As of Mar 31, 2023, Reinsurance Group had assets worth $89.1 billion, down 1.3% year over year.
As of Mar 31, 2023, Reinsurance Group’s book value per share, excluding accumulated other comprehensive income, increased 3.9% year over year to $136.56.
Adjusted operating return on equity excluding accumulated other comprehensive income was 11.2%, reflecting an expansion of 410 bps year over year.
Reinsurance Group exited the quarter with $1.4 billion in excess capital.
Capital Deployment
RGA deployed $194 million into in-force and other transactions and bought back shares worth $50 million.
Effective May 2, 2023, the board declared a regular quarterly dividend of 80 cents per share. The dividend will be paid out on May 30 to shareholders of record at the close of business as of May 16, 2023.
Zacks Rank
Reinsurance Group currently carries a Zacks Rank #3 (Hold). You can see the complete list of today’s Zacks #1 Rank (Strong Buy) stocks here.
Performance of Other Insurers
AXIS Capital Holdings Limited AXS posted first-quarter 2023 operating income of $2.33 per share, beating the Zacks Consensus Estimate by 23.2%. The bottom line increased 11.5% year over year. Total operating revenues of $1.3 billion missed the Zacks Consensus Estimate by 6.7%. The top line, however, rose 0.6% year over year on higher net investment income. Net investment income increased 47.2% year over year to $134 million, primarily attributable to an increase in income from fixed maturities due to improved yields.
Total expenses in the quarter under review increased 1.9% year over year to $1.14 billion, attributable to higher interest expense and financing costs. Pre-tax catastrophe and weather-related losses and net of reinsurance were $38 million, primarily attributable to New Zealand floods, Cyclone Gabrielle and other weather-related events. This compares favorably with the year-ago loss of $60 million. AXIS Capital’s underwriting income of $139.4 million increased 0.4% year over year. The combined ratio improved 50 bps to 90.9.
First American Financial Corporation FAF reported first-quarter 2023 operating income per share of 49 cents, which beat the Zacks Consensus Estimate by a cent. The bottom line decreased 58.1% year over year. Operating revenues of $1.4 billion decreased 29% year over year. The top line beat the Zacks Consensus Estimate by 1.5%. The figure was in line with our estimate.
Investment income was $125 million in the first quarter, more than double year over year. The increase was primarily due to rising interest rates, which drove higher interest income from the cash and investment portfolio, escrow balances and tax-deferred property exchange balances. The impact of higher interest rates was partly offset by lower average balances, primarily in the company’s escrow and tax-deferred exchange balances. The figure was lower than our estimate of $144 million.
American Financial Group, Inc. AFG reported first-quarter 2023 net operating earnings per share of $2.89, which surpassed the Zacks Consensus Estimate by 0.3% as well as our estimate of $2.72 per share. The bottom line decreased 18.8% year over year. Total revenues of $1.7 billion increased 11.3% year over year in the quarter. The growth came on the back of higher P&C insurance net earned premiums and other income. The top line beat the Zacks Consensus Estimate by 4.5% and matched our estimate of $1.7 billion.
P&C insurance net earned premiums of $1.4 billion climbed 10.4% year over year. Net investment income decreased 5.6% year over year to $217 million in the quarter under review. The figure was higher than our estimate of $169.3 million. Total cost and expenses increased 20.3% year over year to $1.4 billion due to higher P&C insurance losses and expenses, cost of managed investment entities and other expenses. The figure matched our estimate of $1.4 billion.
Want the latest recommendations from Zacks Investment Research? Today, you can download 7 Best Stocks for the Next 30 Days. Click to get this free report
Axis Capital Holdings Limited (AXS) : Free Stock Analysis Report
First American Financial Corporation (FAF) : Free Stock Analysis Report
Reinsurance Group of America, Incorporated (RGA) : Free Stock Analysis Report
American Financial Group, Inc. (AFG) : Free Stock Analysis Report
