How Has Remor Solar Polska SA’s (WSE:RSP) Performed Against The Industry?

Measuring Remor Solar Polska SA’s (WSE:RSP) track record of past performance is a useful exercise for investors. It enables us to understand whether or not the company has met or exceed expectations, which is an insightful signal for future performance. Today I will assess RSP’s recent performance announced on 30 June 2018 and weigh these figures against its long-term trend and industry movements.
Check out our latest analysis for Remor Solar Polska
How Did RSP’s Recent Performance Stack Up Against Its Past?
RSP’s trailing twelve-month earnings (from 30 June 2018) of zł21.1k has
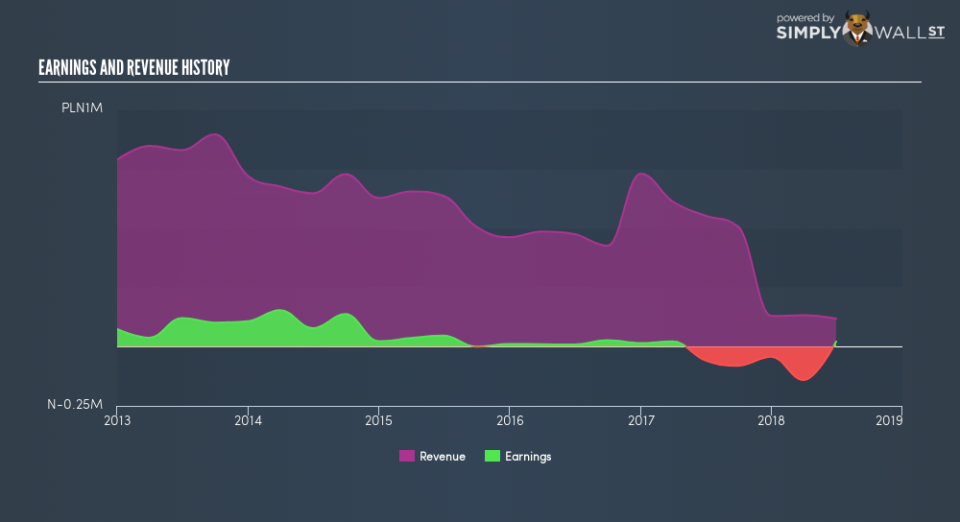
In terms of returns from investment, Remor Solar Polska has fallen short of achieving a 20% return on equity (ROE), recording 0.4% instead. Furthermore, its return on assets (ROA) of 1.4% is below the PL Electrical industry of 3.4%, indicating Remor Solar Polska’s are utilized less efficiently. And finally, its return on capital (ROC), which also accounts for Remor Solar Polska’s debt level, has declined over the past 3 years from 2.0% to 0.3%. This correlates with an increase in debt holding, with debt-to-equity ratio rising from 4.7% to 27.9% over the past 5 years.
What does this mean?
While past data is useful, it doesn’t tell the whole story. I suggest you continue to research Remor Solar Polska to get a better picture of the stock by looking at:
Future Outlook: What are well-informed industry analysts predicting for RSP’s future growth? Take a look at our free research report of analyst consensus for RSP’s outlook.
Financial Health: Are RSP’s operations financially sustainable? Balance sheets can be hard to analyze, which is why we’ve done it for you. Check out our financial health checks here.
Other High-Performing Stocks: Are there other stocks that provide better prospects with proven track records? Explore our free list of these great stocks here.
NB: Figures in this article are calculated using data from the trailing twelve months from 30 June 2018. This may not be consistent with full year annual report figures.
To help readers see past the short term volatility of the financial market, we aim to bring you a long-term focused research analysis purely driven by fundamental data. Note that our analysis does not factor in the latest price-sensitive company announcements.
The author is an independent contributor and at the time of publication had no position in the stocks mentioned. For errors that warrant correction please contact the editor at editorial-team@simplywallst.com.
