Retail REIT Industry Outlook: Online Shift to Mute Growth

Retail REITs are struggling as mall traffic continues to suffer from the rapid shift in customers' shopping preference to the online channel. In fact, with ecommerce gaining market share from the traditional brick-and-mortar stores, retailers are compelled to reconsider their footprint and eventually opt for store closures, while others unable to cope with competition have been filing bankruptcies. These have raised concerns over cash flows of mall landlords.
Specifically, the first half of 2018 witnessed several preeminent retail bankruptcy filings and record-high defaults by retail corporates. Moreover, data from real estate research firm Reis, cited by Reuters, revealed that the national retail vacancy rate marginally increased to 10.2% in second-quarter 2018 — underlining store closures of bankrupt toy retailer, Toys “R” Us Inc. — while national average asking rents edged 0.2% higher. Particularly, U.S. retail absorption was hit hard as net absorption was a negative 3.8 million square feet in the quarter. This compared with 909,000 square feet in the year-ago period.
Such an environment has also led to tenants demanding substantial lease concessions but mall landlords are finding these unjustified. In addition, when substantial store closures happen in the middle of the lease term, not only are mall landlords hurt, tenants occupying space in that mall are equally affected because their shop visits being dependent on the mix of specific types of retailers.
However, retail REITs are fighting back and transforming their traditional retail hubs into entertainment destinations and lifestyle resorts in an attempt to lure customers. These REITs are avoiding heavy dependence on apparel and accessories, and rather expanding dining options, opening movie theaters, offering recreational facilities and opening fitness centers in particular. Also, retail REITs are exploring mixed-use development option, which has gained immense popularity in recent years.
But, in the process, vacancies are escalating in Class B- and below properties. Moreover, with huge outlay for refurbishments, growth in the profit margins of retail REITs in the near term are likely to be curbed.
Industry Lags in Terms of Shareholder Returns
Looking at shareholder returns year to date, it appears that the broader economic recovery wasn’t enough to enhance investors’ confidence in the industry’s growth prospects. In fact, several preeminent retail bankruptcy filings and record-high defaults by retail corporates have affected mall traffic and muted performance of retail REIT industry over the past quarters.
The REIT and Equity Trust - Retail Industry, which is a group within the broader Zacks Finance Sector, has underperformed the S&P 500 but outperformed its own sector, year to date. While the stocks in this industry have collectively gained 0.4% and the Zacks S&P 500 Composite has rallied 8.2%, the Zacks Finance Sector declined 1.8%.
Year-To-Date Price Performance
Valuation Looks Reasonable
For REITs, price-to-FFO (funds from operations) multiple is a common measure for valuation. This is because FFO is a widely used metric to gauge the performance of REITs rather than net income, as it indicates cash flow from their operations.
FFO is obtained after adding depreciation and amortization to earnings and subtracting the gains on sales. This is done because although per GAAP accounting norms, REITs are required to depreciate their investment properties over time, in reality many properties experience value appreciation over time.
So, to offset that impact, depreciation and amortization are added back. Moreover, gains on sales of property are subtracted since such sales are considered nonrecurring in nature.
Despite the underperformance of the industry year to date, the valuation does not look cheap when compared to its median level of the range over this period. The industry currently has a trailing 12-month P/FFO of 14.96 and the median level is 14.7. However, considering the highest level of 15.58 year to date, there is some upside left.
On the other hand, the space also looks inexpensive when compared with the market at large, as the trailing 12-month P/E ratio for the S&P 500 is 19.99 and the median level is 20.08.
Price-to-FFO (TTM)

Underperformance May Continue Due to Bleak FFO per Share Outlook
The U.S. economy is gaining strength, and consumer spending continues to be robust amid tax cuts and a tighter labor market, which is pushing up wages. This is evident from the better-than-expected retail sales figure for July. Sales increased not only at non-store retailers the month, but also at clothing stores, bars and restaurants. Moreover, retail REITs are making concerted efforts to boost productivity of retail assets by trying to grab attention from new and productive tenants and disposing the non-productive ones. Further, with limited retail supply, refurbishment of existing properties is gaining traction.
But what really matters to investors is whether this group has the potential to perform better than the broader market in the quarters ahead. In fact, one should not really consider the current price levels as good entry points unless there are convincing reasons to predict a rebound in the near term.
One reliable measure that can help investors understand the industry’s prospects for a solid price performance going forward is its FFO per share outlook. FFO per share revisions trend for the constituent companies usually influences their stock market performance.
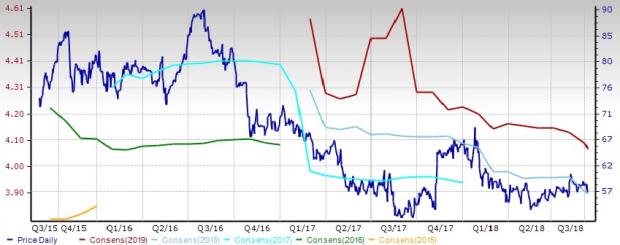
The Price & Consensus chart for the industry shows the market's evolving bottom-up FFO per share expectations and the industry's aggregate stock market performance. The red line in the chart represents the Zacks measure of consensus FFO per share expectations for 2019, while the light blue line represents the same for 2018.
Price and Consensus: Zacks REIT-Equity Trust – Retail industry
This becomes even clearer if we focus on the aggregate bottom-up FFO per share revisions trend. The chart below shows the evolution of aggregate consensus expectations for 2018.
Please note that the $3.37 FFO per share estimate for the industry for 2018 is not the actual bottom-up dollar FFO per share estimate for every company in the REIT - Equity Trust - Retail industry, but rather an illustrative aggregate created by our proprietary analytics model. The key factor to keep in mind is not the FFO per share of the industry for 2018, but how this value has evolved recently.
Current Fiscal Year FFO Per Share Estimate Revisions
As you can see here, the $3.37 FFO per share estimate for 2018 is unchanged from the end of July but down marginally from June 2018 as well as from $3.44 this time last year. Looking at the aggregate FFO per share estimate revisions, it appears that analysts became somewhat pessimistic about this group’s FFO per share potential.
Zacks Industry Rank Indicates Cloudy Prospects
The group’s Zacks Industry Rank, which is basically the average of the Zacks Rank of all the member stocks, indicates continued underperformance in the near term.
The Zacks REIT and Equity Trust – Retail industry currently carries a Zacks Industry Rank #200, which places it at the bottom 22% of more than 250 Zacks industries. Our research shows that the top 50% of the Zacks-ranked industries outperforms the bottom 50% by a factor of more than 2 to 1.
Revenue Trend of Retail REITs Shows Some Promise
While the near-term prospects look unwelcoming for investors, the uptrend in revenues over the past years appears promising. This might support long-term growth in FFO per share.
Bottom Line
Keeping the long-term expectations in mind, investors should consider a reshuffle of stocks in their portfolio. On one hand, they should consider keeping some top notch retail REITs that are anticipated to rebound over time. On the other hand, staying away from some stocks from the said industry that are unlikely to bounce back in the near term should be a prudent decision.
Here are the stocks to hold on to:
Simon Property Group, Inc. (SPG): The stock of this Indianapolis, IN-based retail REIT, has gained 10.4% over the past three months. It is expected to benefit from new development, redevelopment, expansion and acquisition efforts. The Zacks Consensus Estimate for the 2018 FFO per share has been revised 0.5% upward over the last 60 days. It has a Zacks Rank #3 (Hold). (You can see the complete list of today’s Zacks #1 Rank (Strong Buy) stocks here.)
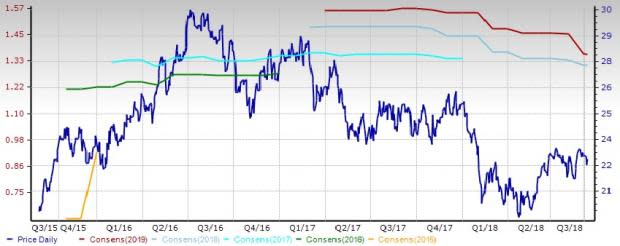
Price and Consensus: SPG
Realty Income Corporation (O): The consensus FFO per share estimate for this San Diego, CA-based REIT marginally moved north for both 2018 and 2019, over the last 30 days. Most importantly, this freestanding retail REIT derives more than 90% of its annualized retail rental revenues from tenants belonging to service, non-discretionary and low-price retail business. Such businesses are less susceptible to economic recessions, as well as competition from Internet retailing. The stock has appreciated 9.1% over the past three months. It has a Zacks Rank of 3.
Price and Consensus: O
Here are the stocks to stay away from:
The Macerich Company (MAC): The stock of this Santa Monica, CA-based retail REIT has lost 3.1% of its value over the past six months. The consensus FFO per share estimate for the current year has been revised 1.8% downward over the last 30 days. It has a Zacks Rank of 4 (Sell).
Price and Consensus: MAC
Urban Edge Properties (UE): The consensus FFO per share estimate for this New York-based retail REIT has moved 2.2% lower for the current year, over the last 60 days. The stock has inched up just 1.2% over the past three months. It has a Zacks Rank of 5 (Strong Sell).
Price and Consensus: UE
More Stock News: This Is Bigger than the iPhone!
It could become the mother of all technological revolutions. Apple sold a mere 1 billion iPhones in 10 years but a new breakthrough is expected to generate more than 27 billion devices in just 3 years, creating a $1.7 trillion market.
Zacks has just released a Special Report that spotlights this fast-emerging phenomenon and 6 tickers for taking advantage of it. If you don't buy now, you may kick yourself in 2020.
Click here for the 6 trades >>
Want the latest recommendations from Zacks Investment Research? Today, you can download 7 Best Stocks for the Next 30 Days. Click to get this free report
Urban Edge Properties (UE) : Free Stock Analysis Report
Simon Property Group, Inc. (SPG) : Free Stock Analysis Report
Realty Income Corporation (O) : Free Stock Analysis Report
Macerich Company (The) (MAC) : Free Stock Analysis Report
To read this article on Zacks.com click here.
Zacks Investment Research
