Can Retail Stocks Maintain Their Momentum?


The earnings focus shifts to the Retail sector this week as traditional brick-and-mortar retailers come out with quarterly results. Stocks of most of these traditional operators have done better than the broader markets this year, except for Wal-Mart (WMT) which reports before the market’s open on Thursday and whose stock has been a notable laggard since the company’s last earnings release back in mid-February. The company’s recent big Indian purchase has failed to reverse the stock’s underperformance, with the stock now down -14.8% in the year-to-date period.
In total, we have 125 companies on deck to come out with Q1 results, including 10 S&P 500 members. Macy’s (M), Nordstrom (JWN), Wal-Mart (WMT) and Home Depot (HD) are major retailers reporting results this week, with Cisco (CSCO) and Deere & Company (DE) as the other notable reports.
Macy’s, Nordstrom and other department store stocks have been strong performers this year, with Macy’s up +18.7% and Nordstrom up +3.5% in the year-to-date period, doing better than the S&P 500’s +2.5% gain. Driving this recent momentum is the market’s optimism about these companies’ restructuring and competitive repositioning, with Macy’s actively bringing down its physical footprint and investing in its digital platform. We will see if either Macy’s or Nordstrom can sustain these gains after they come out with results in the next few days.
The Zacks Retail sector is up +7% in the year-to-date period, doing better than the broader market. Helping the sector’s recent outperformance is the aforementioned positive momentum in the stock prices of Macy’s and other traditional retailers. But we should keep in mind that the Zacks Retail sector also includes online vendors like Amazon (AMZN) in addition to traditional brick-and-mortar operators.
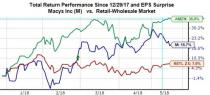
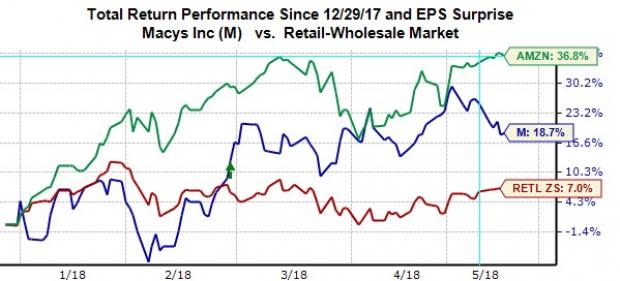
You can clearly see this dynamic at play in the year-to-date chart below plotting Macy’s (blue line) against the Zacks Retail sector (red line) and Amazon (green line).
The recent momentum in these traditional retail stocks notwithstanding, the group remains on a long-term downtrend, as you can see in the chart below.
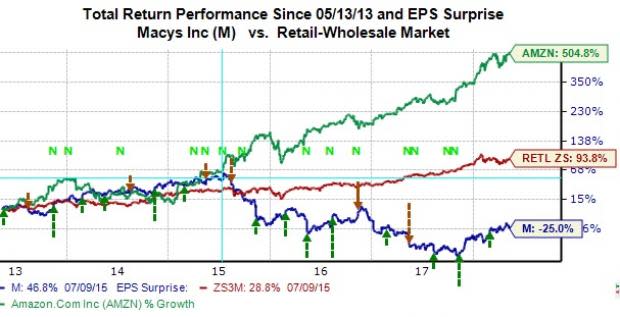
The only difference between this chart and the earlier one is time – this chart represents a 5-year period while the earlier one represents the year-to-date period. As you can see, Macy’s shares are down -25% over this longer time horizon.
There is another very interesting aspect to this chart as well. The blue (Macy’s) and green (Amazon) lines moving in lock-step with each other in the earlier part of the chart - through July 17, 2015 to be precise. In other words, what seem such obvious existential secular headwinds facing Macy’s and its peers at present are only so with the benefit of hindsight; the market had no idea what lay ahead for Macy’s and its peers prior to that July day in 2015.
The takeaway from this discussion is that many trends that appear crystal clear in retrospect are anything but that in real time.
What’s the significance of that date in July 2015? Amazon held its first Prime Day on July 15th to celebrate the 20th anniversary of its founding, which it claimed turned out to be bigger than Black Friday. As you can see in the chart above, the world has never been the same since that day, particularly for Macy’s and its department store peers.
Retail Sector Scorecard
We now have Q1 results from 50% of the retailers in the S&P 500 index. Total earnings for these Retail sector companies that have reported results already are up +26.1% from the same period last year on +14.9% higher revenues, with 68.4% beating EPS estimates and 63.2% beating revenue estimates.
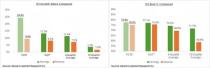
The comparison charts below put the sector’s Q1 results in a historical context.

The Retail sector results thus far are from the online vendors and restaurant players, with ‘traditional’ operators starting to report only this week. The comparison charts above show that while growth (both earnings as well as revenues) is tracking notably above historical periods, the proportion of positive surprises is on the weak side.
With respect to growth, Amazon’s blockbuster numbers, particularly on the revenues front, has a big role in the very strong growth picture at this stage. Amazon’s Q1 earnings increased +125% on +42.9% higher revenues, with the net dollar increase in the online retailer’s revenues an impressive $15.3 billion.
The comparison charts below try to look at the sector’s growth picture with and without the Amazon contribution.

As you can see in the right-hand chart above, Q1 growth is still tracking above historical periods, but the growth rate is a lot lower on an ex-Amazon basis.
Q1 Earnings Season Scorecard (as of Friday, May 11th)
For the S&P 500 index as a whole, we now have Q1 results from 455 index members. Total earnings for the 455 index members that have reported results already are up +24.4% from the same period last year on +9.4% higher revenues, with 77.6% beating EPS estimates and 75.2% beating revenue estimates. The proportion of companies beating both EPS and revenue estimates is 62.9%.
To put these results in a historical context, the charts below compare the results thus far with what we had seen from the same group of 455 index members in other recent periods.
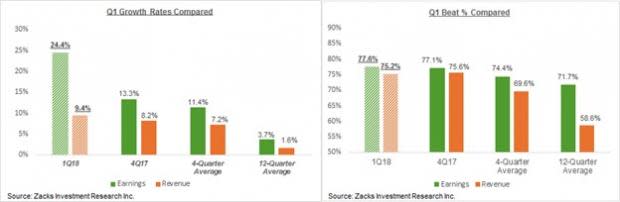
Earnings and revenue growth rate and the proportion of positive EPS surprises is tracking above what we have been seeing from the same group of 455 index members. But revenue surprises are tracking modestly below the preceding earnings season, but remain above historical periods.
What’s Happening to 2018 Q2 Estimates?
The chart below plots the evolution of earnings growth expectations for the current period. As you can see, there has been no incremental improvement in the earnings outlook relative to what was expected ahead of the start of this earnings season.
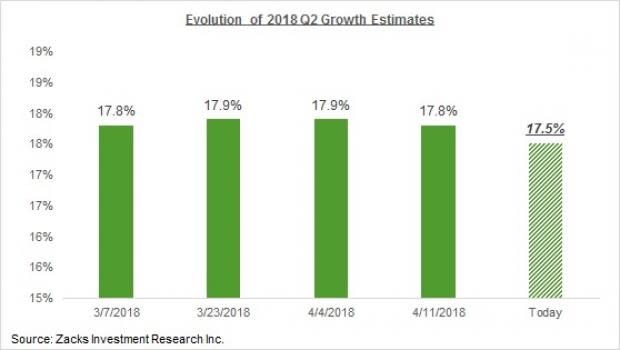
A big part of the positive revisions we saw ahead of the start of the Q1 earnings season reflected the direct impact of the tax law changes, which was obviously a one-off development. Had all positive revisions been a result of tax law changes, we would have seen only EPS estimates go up, with no changes to revenue estimates. But that wasn’t the case, as revenue estimates had gone up as well, which raised our hopes that the aggregate revisions trend had finally turned positive after many years being in the other direction.
Disappointingly, we are not seeing that with estimates for Q2, as the above chart shows. In other words, the growth picture coming out of this earnings season is very impressive, but there is no improvement in expectations for the current and coming quarters. The recent uptrend in the exchange value of the U.S. dollar and questions about global growth will likely serve as incremental negatives for folks like us monitoring the aggregate revisions trend.
This flat aggregate revisions trend notwithstanding, June quarter estimates have actually modestly ticked down for 11 of the 16 Zacks sectors and gone up for 4 sectors. The sectors enjoying positive revisions in the aggregate include Technology, Industrial Products, Basic Materials and Retail.
Note: Sheraz Mian manages the Zacks equity research department. He is an acknowledged earnings expert whose commentaries and analyses appear on Zacks.com and in the print and electronic media. His weekly earnings related articles include Earnings Trends and Earnings Preview. He manages the Zacks Top 10 and Focus List portfolios and writes the Weekly Market Analysis article for Zacks Premium subscribers.
Here is a list of the 126 companies including 10 S&P 500 and reporting this week.
Company | Ticker | Current Qtr | Year-Ago Qtr | Last EPS Surprise % | Report Day | Time |
NINE ENERGY SVC | NINE | 0.14 | N/A | 6.25% | Monday | BTO |
ATYR PHARMA INC | LIFE | -0.35 | -0.56 | 9.30% | Monday | BTO |
CYNERGISTEK INC | CTEK | 0.1 | 0.11 | 122.22% | Monday | BTO |
LONESTAR RESRCS | LONE | -0.16 | -0.18 | 25.00% | Monday | BTO |
MAZOR ROBOTICS | MZOR | N/A | -0.22 | 55.88% | Monday | BTO |
HANWHA Q CELLS | HQCL | 0.14 | 0.21 | 20.00% | Monday | BTO |
WESTWATER RES | WWR | -0.12 | -0.11 | 15.38% | Monday | BTO |
ALTA MESA RSRCS | AMR | 0.08 | N/A | N/A | Monday | BTO |
REMARK MEDIA | MARK | -0.35 | 0 | -252.00% | Monday | BTO |
AGILENT TECH | A | 0.65 | 0.58 | 13.79% | Monday | AMC |
REXNORD CORP | RXN | 0.39 | 0.35 | 37.04% | Monday | AMC |
VERTEX ENERGY | VTNR | -0.06 | -0.12 | 33.33% | Monday | AMC |
CYCLACEL PHARMA | CYCC | -0.13 | -0.38 | N/A | Monday | AMC |
SITO MOBILE LTD | SITO | -0.09 | -0.07 | 11.76% | Monday | AMC |
INVITATION HOME | INVH | 0.28 | -0.14 | 7.41% | Monday | AMC |
ITRON INC | ITRI | 0.13 | 0.57 | 7.45% | Monday | AMC |
MERSANA THERPTS | MRSN | -0.61 | N/A | -27.08% | Monday | AMC |
DICERNA PHARMA | DRNA | -0.41 | -0.68 | -18.42% | Monday | AMC |
SWITCH INC-A | SWCH | 0.04 | N/A | 14.29% | Monday | AMC |
ECO-STIM ENERGY | ESES | -0.06 | -0.34 | -133.33% | Monday | AMC |
MIMECAST LTD | MIME | -0.07 | -0.05 | -25.00% | Monday | AMC |
AMYRIS INC | AMRS | -0.47 | -2.1 | -342.86% | Monday | AMC |
ATLANTICA YIELD | AY | -0.02 | -0.12 | -215.79% | Monday | AMC |
CORIUM INTRNTNL | CORI | -0.41 | -0.42 | 13.95% | Monday | AMC |
LIGHTPATH TECH | LPTH | 0.02 | 0.03 | 500.00% | Monday | AMC |
ROSEHILL RESRCS | ROSE | 0.04 | -0.22 | N/A | Monday | AMC |
SARATOGA INVEST | SAR | 0.53 | 0.19 | -1.82% | Monday | AMC |
AVINGER INC | AVGR | N/A | -25.6 | -13.04% | Monday | AMC |
BOVIE MEDICAL | BVX | -0.01 | -0.06 | -50.00% | Monday | AMC |
EDAP TMS SA-ADR | EDAP | -0.02 | 0.13 | 0.00% | Monday | AMC |
ERYTECH PHARMA | ERYP | -0.59 | N/A | N/A | Monday | AMC |
FIVE POINT HLDG | FPH | -0.05 | -0.2 | -163.64% | Monday | AMC |
HOLLYSYS AUTOMT | HOLI | 0.35 | 0.22 | 53.85% | Monday | AMC |
POLAR POWER INC | POLA | -0.01 | 0.06 | -500.00% | Monday | AMC |
PIONEER PWR SOL | PPSI | 0.02 | 0.17 | 18.75% | Monday | AMC |
RESHAPE LIFESCI | RSLS | N/A | -1.27 | 9.00% | Monday | AMC |
TIDEWATER INC | TDW | -0.83 | N/A | -32.47% | Monday | AMC |
VIPSHOP HOLDNGS | VIPS | 0.13 | 0.15 | 26.67% | Monday | AMC |
VOXX INTL CP | VOXX | 0.05 | 0 | 164.29% | Monday | AMC |
XCEL BRANDS INC | XELB | N/A | 0 | 100.00% | Monday | AMC |
CENT PUERTO-ADR | CEPU | N/A | N/A | N/A | Monday | AMC |
ALTAIR ENGINEER | ALTR | 0.03 | N/A | 150.00% | Monday | AMC |
ORTHOPEDIATRICS | KIDS | -0.28 | N/A | -2923.08% | Monday | AMC |
INTELLICHECK MO | IDN | -0.07 | -0.09 | 0.00% | Monday | AMC |
CDTI ADV MATS | CDTI | -0.08 | -0.19 | 66.67% | Monday | AMC |
NETSHOES CAYMAN | NETS | -0.32 | -0.57 | -183.33% | Monday | AMC |
SENESTECH INC | SNES | -0.15 | -0.34 | 21.05% | Monday | AMC |
WIDEPOINT CORP | WYY | 0 | -0.01 | 100.00% | Monday | AMC |
INNOVUS PHARMA | INNV | N/A | -0.02 | N/A | Monday | AMC |
CHINA LODGING | HTHT | N/A | 0.3 | 50.00% | Monday | AMC |
HOME DEPOT | HD | 2.07 | 1.67 | 4.32% | Tuesday | BTO |
CORPORATE CAPTL | CCT | 0.43 | N/A | N/A | Tuesday | BTO |
CPI AEROSTRUCTR | CVU | 0.1 | 0.14 | 0.00% | Tuesday | BTO |
GOODRICH PET CP | GDP | -0.04 | -0.63 | -183.33% | Tuesday | BTO |
EAGLE MATERIALS | EXP | 1.04 | 0.88 | 13.99% | Tuesday | BTO |
NATL VISION HLD | EYE | 0.4 | N/A | 80.00% | Tuesday | BTO |
AFFIMED THERAP | AFMD | -0.18 | -0.2 | 0.00% | Tuesday | BTO |
KAMADA LTD | KMDA | 0.03 | -0.11 | 166.67% | Tuesday | BTO |
VIRTUSA CORP | VRTU | 0.37 | 0.25 | -36.67% | Tuesday | BTO |
AZZ INC | AZZ | 0.39 | 0.44 | -21.95% | Tuesday | BTO |
CONCORDIA INTL | CXRX | N/A | -0.37 | -566.67% | Tuesday | BTO |
DARIOHEALTH CP | DRIO | N/A | 0.45 | -3.45% | Tuesday | BTO |
GREENTREE HOSPT | GHG | 0.09 | N/A | N/A | Tuesday | BTO |
H2O INNOVATION | HEOFF | 0 | 0 | -200.00% | Tuesday | BTO |
POINTER TELOCAT | PNTR | 0.27 | 0.29 | 22.73% | Tuesday | BTO |
PALATIN TECH | PTN | -0.04 | -0.02 | -16.67% | Tuesday | BTO |
TECOGEN INC | TGEN | 0 | 0 | 100.00% | Tuesday | BTO |
CRONOS GROUP | CRON | N/A | -0.01 | N/A | Tuesday | BTO |
UROGEN PHARMA | URGN | -0.73 | N/A | -13.85% | Tuesday | BTO |
FIVE STAR QLTY | FVE | N/A | -0.14 | -25.00% | Tuesday | BTO |
ALDEYRA THERAPT | ALDX | -0.37 | -0.37 | -15.63% | Tuesday | BTO |
DIGITAL ALLY IN | DGLY | N/A | -0.29 | -80.77% | Tuesday | BTO |
FUSION CONNECT | FSNN | -0.13 | -0.34 | -11.76% | Tuesday | BTO |
SORL AUTO PARTS | SORL | 0.19 | 0.36 | 144.44% | Tuesday | BTO |
LIMBACH HOLDNGS | LMB | 0.05 | -0.1 | -157.14% | Tuesday | AMC |
ONCOCYTE CORP | OCX | -0.13 | -0.16 | 7.69% | Tuesday | AMC |
BOOT BARN HLDGS | BOOT | 0.17 | 0.12 | 2.22% | Tuesday | AMC |
PETIQ INC | PETQ | 0.05 | N/A | 280.00% | Tuesday | AMC |
GLADSTONE INVES | GAIN | 0.18 | 0.17 | 27.78% | Tuesday | AMC |
AVINO SILVER&GD | ASM | 0.03 | 0.01 | -120.00% | Tuesday | AMC |
BOXLIGHT CORP | BOXL | -0.12 | N/A | N/A | Tuesday | AMC |
ENSYNC INC | ESNC | -0.05 | -0.09 | 28.57% | Tuesday | AMC |
BIOCEPT INC | BIOC | -0.07 | -0.21 | 5.26% | Tuesday | AMC |
DLH HOLDINGS CP | DLHC | 0.15 | 0.08 | 33.33% | Tuesday | AMC |
NETLIST INC | NLST | -0.03 | -0.05 | 0.00% | Tuesday | AMC |
PARKERVISION | PRKR | N/A | -0.33 | -4.35% | Tuesday | AMC |
PURPLE INNOVATN | PRPL | -0.04 | -0.04 | N/A | Tuesday | AMC |
SOCIAL REALITY | SRAX | N/A | -0.39 | -566.67% | Tuesday | AMC |
SUNWORKS INC | SUNW | -0.1 | -0.14 | -550.00% | Tuesday | AMC |
RYB EDUCATION | RYB | N/A | N/A | N/A | Tuesday | AMC |
SALZGITTER AG | SZGPY | N/A | 0.09 | N/A | Tuesday | N/A |
THYSSENKRUPP AG | TKAMY | N/A | 0.11 | N/A | Tuesday | N/A |
DOLPHIN ENTMNT | DLPN | N/A | -0.68 | N/A | Tuesday | N/A |
MACYS INC | M | 0.36 | 0.24 | 4.83% | Wednesday | BTO |
CANADIAN SOLAR | CSIQ | 0.38 | -0.1 | 21.69% | Wednesday | BTO |
OBSEVA SA | OBSV | -0.46 | -0.58 | 14.29% | Wednesday | BTO |
ALTIMMUNE INC | ALT | -0.5 | -0.3 | 76.00% | Wednesday | BTO |
MAGIC SOFTWARE | MGIC | 0.13 | 0.13 | -15.38% | Wednesday | BTO |
CISCO SYSTEMS | CSCO | 0.59 | 0.54 | 9.43% | Wednesday | AMC |
TAKE-TWO INTER | TTWO | 0.44 | 0.65 | 40.48% | Wednesday | AMC |
JACK IN THE BOX | JACK | 0.86 | 0.98 | 16.04% | Wednesday | AMC |
DYNAGAS LNG PTR | DLNG | 0.15 | 0.37 | -11.11% | Wednesday | AMC |
FLOWERS FOODS | FLO | 0.3 | 0.25 | 21.43% | Wednesday | AMC |
ACXIOM CORP | ACXM | 0.08 | 0.03 | 54.55% | Wednesday | AMC |
NETEASE INC | NTES | 1.88 | 4.29 | -1.97% | Wednesday | AMC |
WALMART INC | WMT | 1.13 | 1 | -2.21% | Thursday | BTO |
BAOZUN INC | BZUN | N/A | 0.07 | -12.50% | Thursday | BTO |
PENNEY (JC) INC | JCP | -0.22 | 0.06 | 26.67% | Thursday | BTO |
TEEKAY TANKERS | TNK | -0.08 | 0.04 | 50.00% | Thursday | BTO |
ALBIREO PHARMA | ALBO | 3.75 | -1.06 | 29.49% | Thursday | BTO |
KEMET CORP | KEM | 0.39 | 0.12 | 50.00% | Thursday | BTO |
TEEKAY LNG PTNR | TGP | 0.33 | 0.22 | 9.38% | Thursday | BTO |
TEEKAY OFFSHORE | TOO | 0 | 0.02 | -90.00% | Thursday | BTO |
EAGLE POINT CRD | ECC | 0.45 | 0.52 | -4.44% | Thursday | BTO |
TEEKAY CORP | TK | -0.08 | -0.41 | -120.00% | Thursday | BTO |
CHILDRENS PLACE | PLCE | 2.22 | 1.95 | 1.20% | Thursday | BTO |
MANCHESTER UTD | MANU | -0.03 | -0.05 | 0.00% | Thursday | BTO |
NORDSTROM INC | JWN | 0.42 | 0.43 | -3.23% | Thursday | AMC |
APPLD MATLS INC | AMAT | 1.13 | 0.79 | 9.28% | Thursday | AMC |
ORION ENGINRD | OEC | 0.53 | 0.38 | 4.65% | Thursday | AMC |
VOXELJET AG-ADR | VJET | -0.12 | -0.14 | -33.33% | Thursday | AMC |
CAMPBELL SOUP | CPB | 0.61 | 0.59 | 23.46% | Friday | BTO |
DEERE & CO | DE | 3.33 | 2.49 | 12.93% | Friday | BTO |
APOLLO INV CP | AINV | 0.16 | 0.17 | 0.00% | Friday | BTO |
ASTRAZENECA PLC | AZN | 0.28 | 0.99 | 188.89% | Friday | BTO |
Want the latest recommendations from Zacks Investment Research? Today, you can download 7 Best Stocks for the Next 30 Days. Click to get this free report
Walmart Inc. (WMT) : Free Stock Analysis Report
Macy's, Inc. (M) : Free Stock Analysis Report
Nordstrom, Inc. (JWN) : Free Stock Analysis Report
The Home Depot, Inc. (HD) : Free Stock Analysis Report
Deere & Company (DE) : Free Stock Analysis Report
Cisco Systems, Inc. (CSCO) : Free Stock Analysis Report
Amazon.com, Inc. (AMZN) : Free Stock Analysis Report
To read this article on Zacks.com click here.
Zacks Investment Research
