The Year In Review
This article was originally published on ETFTrends.com.
By Roman Chuyan, CFA
Our 6-month Equity model’s forecast for the S&P 500 drops to -8.4%, and the Short-Term Risk model continues with a Sell signal. Both models dictate continued defensive positioning.
I review the 2021 highlights and offer my thoughts on what lies ahead in the new year.
I hope you and your family had a safe and relaxing holiday. As we enter the new year, I focus today’s comments on the highlights of 2021, and what we think lies ahead.
At the top of the list of course is the tremendous, even if surprising, stock market rally – the S&P 500 gained 27% in 2021. I wrote extensively about this throughout the year as it unfolded from simply an overvalued market to bubble proportions. According to Shiller’s P/E Ratio (which accounts for earnings cyclicality), market valuation is now at its highest in 150 years outside of the 1999-2000 dot-com period. Clearly, this is one of the biggest bubbles in market history.

The US economy rebounded strongly after the 2020 pandemic-induced downturn, due largely to monetary stimulus. Growth has moderated more recently, however, as evidenced by only 2.3% annualized real GDP growth in Q3-2021 – positive, but not strong by any measure. Yet, market valuation has rocketed well above pre-pandemic highs. Clearly, fundamentals didn’t drive the upside. As with all bubbles, easy money inflated it this time as well, and it’s now an “everything bubble” in stocks, bonds, real estate, and commodities. The Fed’s bond purchases (which amount to money-creation) and federal stimulus money have each reached around $4 trillion. The tremendous amounts of new money found their way into financial assets.
[wce_code id=192]

The second exceptional development last year was the remarkable surge in inflation. Consumer (CPI) inflation jumped to 6.9% (see chart) – its highest in 39 years, since 1982. Core inflation, excluding food and energy, rose to its highest since 1991.
It’s clear that the new money created inflation. The Fed, which was responsible for half of the money-creation, willingly ignored inflation even after it surged and became a clear problem around April-May. They began talking about it only in mid-December, after Fed Chairman Powell’s reappointment for a second term. The Fed is now projected to end its bond-buying in March of 2022, but will continue fueling inflation until then. The Fed’s “tapering” seems to be too little, too late. It took above-10% Treasury rates to win the fight against inflation in the 1980s; it is currently around 1.5%.
Rising prices reduce real buying power – the amount of goods and services that people can afford. This erodes confidence, and it has already affected consumer sentiment. The University of Michigan’s sentiment index, which includes inflation in its survey, dropped in November to its lowest in 10 years, despite apparent economic growth.
What lies ahead? The Fed’s support is ending, with bond-buying projected to end in March, followed by some rate hikes. Because the Fed is the primary bond buyer at near-zero yield, without it Treasury yields will likely spike – with dire consequences for cost of credit, financial markets, and our entire finance-based economy. No positive scenarios can be seen. In the end all bubbles burst, which means that the downside is expected to be larger than in a typical bear market.
Market Outlook
The 6-month return forecast for the S&P 500 by our fundamentals-based statistical Equity Model decreased to -8.4% from -6.8% last month. The model’s Valuation effect continues to be the most negative factor. A forecast below -5% continues to indicate “Negative Fundamentals.”
As part of our regular annual model development, we updated the Equity model last month with a new factor, M1 Money Supply. A model update makes comparison with earlier periods somewhat difficult.

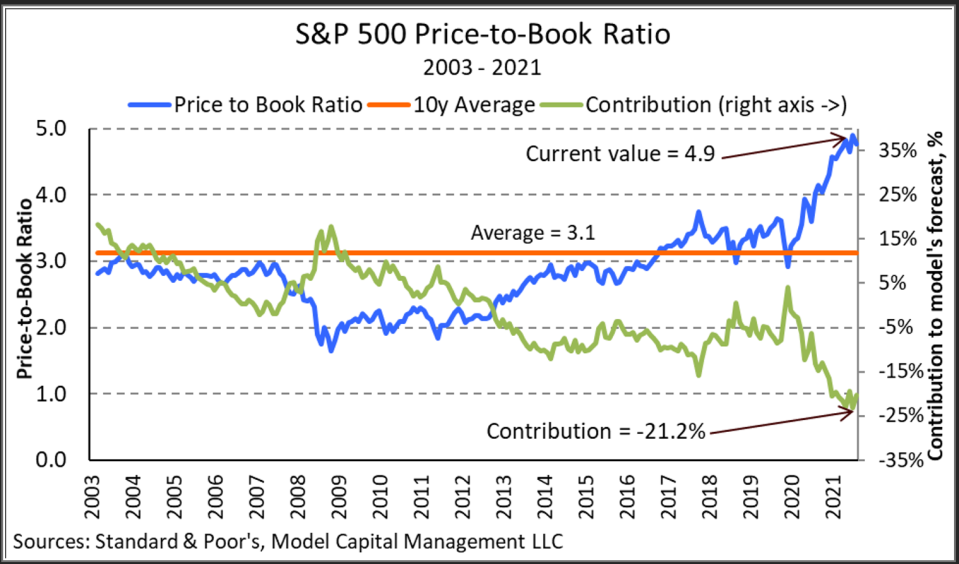
The S&P 500 Price-to-Book Ratio jumped to 4.9 as the index rebounded, matching its multi-decade high reached in October. The Valuation effect at ‑21.2% continues to indicate an extremely overvalued stock market.

The overall effect of the Economic category increased slightly in December, to 9.0%. The deactivation of Median Home Price contributed a negative change, but this was almost entirely offset by increases in the effects of Consumer Confidence and CPI Inflation.

The overall effect of Market factors increased slightly, to 3.8%. The contribution of the Institutional Investor Sentiment dropped sharply in December, but this was almost entirely offset by increases in the effects of Investor Liquidity (Cash Balances), Fund Equity Allocation, and 3-month Treasury.

Our Short-Term Risk model looks for technical patterns that preceded previous sharp market declines. The Momentum component of the model gave a closing Buy signal on Dec 3. However, the weekly Volatility component gave a Sell signal on Dec 17, so this model continues to indicate an elevated chance of a market correction.
The Equity Model’s most negative and positive factors are shown below in historical context (assuming their current weights). The S&P 500 Price-to-Book Ratio jumped to 4.9 as the index rebounded, matching its multi-decade high reached in October. The effect of this factor decreased to -21.2% and continues to indicate an extremely overvalued market.
Individual investor liquidity rebounded slightly last month after a sharp decline in the second half of 2021. The effect of this factor increased to 6.5%, and it continues to be the most positive single factor in the model.

About Model Capital Management LLC
Model Capital Management LLC (“MCM”) is an independent SEC-registered Investment Adviser, and is based in Wellesley, Massachusetts. Utilizing its fundamental, forward-looking approach to asset allocation, MCM provides asset management services aimed to help other advisors implement its dynamic investment strategies designed to reduce significant downside risk. MCM is available to advisors on AssetMark, Envestnet, SMArtX, and other SMA/UMA platforms, but is not affiliated with those firms.
Notices and Disclosures
This research document and all of the information contained in it (“MCM Research”) is the property of MCM. The Information set out in this communication is subject to copyright and may not be reproduced or disseminated, in whole or in part, without the express written permission of MCM. The trademarks and service marks contained in this document are the property of their respective owners. Third-party data providers make no warranties or representations relating to the accuracy, completeness, or timeliness of the data they provide and shall not have liability for any damages relating to such data.
MCM does not provide individually tailored investment advice. MCM Research has been prepared without regard to the circumstances and objectives of those who receive it. MCM recommends that investors independently evaluate particular investments and strategies and encourages investors to seek the advice of an investment adviser. The appropriateness of an investment or strategy will depend on an investor’s circumstances and objectives. The securities, instruments, or strategies discussed in MCM Research may not be suitable for all investors, and certain investors may not be eligible to purchase or participate in some or all of them. The value of and income from your investments may vary because of changes in securities/instruments prices, market indexes, or other factors. Past performance is not a guarantee of future performance, and not necessarily a guide to future performance. Estimates of future performance are based on assumptions that may not be realized.
MCM Research is not an offer to buy or sell or the solicitation of an offer to buy or sell any security/instrument or to participate in any particular trading strategy. MCM does not analyze, follow, research or recommend individual companies or their securities. Employees of MCM may have investments in securities/instruments or derivatives of securities/instruments based on broad market indices included in MCM Research. MCM’s Form ADV, Part 2A (Brochure) contains further details pertaining to employee training.
MCM is not acting as a municipal advisor and the opinions or views contained in MCM Research are not intended to be, and do not constitute, advice within the meaning of Section 975 of the Dodd-Frank Wall Street Reform and Consumer Protection Act.
MCM Research is based on public information. MCM makes every effort to use reliable, comprehensive information, but we make no representation that it is accurate or complete. Opinions or information are subject to change with respect to MCM Research.
MCM DOES NOT MAKE ANY EXPRESS OR IMPLIED WARRANTIES OR REPRESENTATIONS WITH RESPECT TO THIS MCM RESEARCH (OR THE RESULTS TO BE OBTAINED BY THE USE THEREOF), AND TO THE MAXIMUM EXTENT PERMITTED BY LAW, MCM HEREBY EXPRESSLY DISCLAIMS ALL WARRANTIES (INCLUDING, WITHOUT LIMITATION, ANY IMPLIED WARRANTIES OF ORIGINALITY, ACCURACY, TIMELINESS, NON-INFRINGEMENT, COMPLETENESS, MERCHANTABILITY AND/OR FITNESS FOR A PARTICULAR PURPOSE).
“Model Return Forecast” for 6-month S&P 500 return is MCM’s measure of attractiveness of the U.S. equity market obtained by applying MCM’s proprietary statistical algorithm and historical data, but is not promissory, and, by itself, does not constitute an investment recommendation. Model Return Forecasts were calculated and applied by MCM to its research and investment process in real time beginning from 2012. For periods prior to Jan 2012, the results are “back-tested,” i.e., obtained by retroactively applying MCM's algorithm and historical data available in Jan 2012 or thereafter. Back-tested performance, if any, is presented gross of any advisory fees and trading expenses. Index returns referenced in MCM Research, if any, are gross of any advisory fees, fund management fees, and trading expenses. Fund or ETF returns referenced, if any, are gross of advisory fees and trading expenses. Returns will be reduced by fees and expenses incurred.
For more news, information, and strategy, visit the ETF Strategist Channel.
POPULAR ARTICLES AND RESOURCES FROM ETFTRENDS.COM
