RGC Resources, Inc. (NASDAQ:RGCO) Is Yielding 2.6% - But Is It A Buy?

Dividend paying stocks like RGC Resources, Inc. (NASDAQ:RGCO) tend to be popular with investors, and for good reason - some research suggests a significant amount of all stock market returns come from reinvested dividends. If you are hoping to live on your dividends, it's important to be more stringent with your investments than the average punter. Regular readers know we like to apply the same approach to each dividend stock, and we hope you'll find our analysis useful.
A slim 2.6% yield is hard to get excited about, but the long payment history is respectable. At the right price, or with strong growth opportunities, RGC Resources could have potential. When buying stocks for their dividends, you should always run through the checks below, to see if the dividend looks sustainable.
Click the interactive chart for our full dividend analysis
Payout ratios
Dividends are usually paid out of company earnings. If a company is paying more than it earns, then the dividend might become unsustainable - hardly an ideal situation. Comparing dividend payments to a company's net profit after tax is a simple way of reality-checking whether a dividend is sustainable. RGC Resources paid out 53% of its profit as dividends, over the trailing twelve month period. A payout ratio above 50% generally implies a business is reaching maturity, although it is still possible to reinvest in the business or increase the dividend over time.
Another important check we do is to see if the free cash flow generated is sufficient to pay the dividend. Last year, RGC Resources paid a dividend while reporting negative free cash flow. While there may be an explanation, we think this behaviour is generally not sustainable.
Is RGC Resources's Balance Sheet Risky?
As RGC Resources has a meaningful amount of debt, we need to check its balance sheet to see if the company might have debt risks. A rough way to check this is with these two simple ratios: a) net debt divided by EBITDA (earnings before interest, tax, depreciation and amortisation), and b) net interest cover. Net debt to EBITDA measures total debt load relative to company earnings (lower = less debt), while net interest cover measures the ability to pay interest on the debt (higher = greater ability to pay interest costs). RGC Resources has net debt of 5.36 times its EBITDA, which implies meaningful risk if interest rates rise of earnings decline.
We calculated its interest cover by measuring its earnings before interest and tax (EBIT), and dividing this by the company's net interest expense. Interest cover of 3.46 times its interest expense is starting to become a concern for RGC Resources, and be aware that lenders may place additional restrictions on the company as well. High debt and weak interest cover are not a great combo, and we would be cautious of relying on this company's dividend while these metrics persist.
Consider getting our latest analysis on RGC Resources's financial position here.
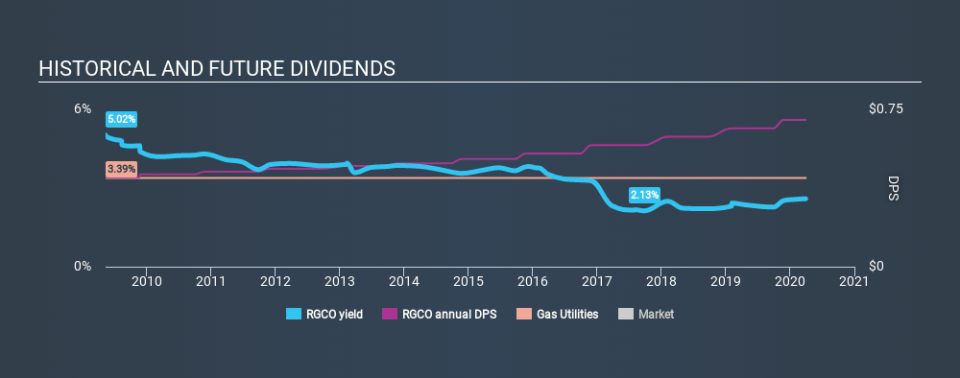
Dividend Volatility
One of the major risks of relying on dividend income, is the potential for a company to struggle financially and cut its dividend. Not only is your income cut, but the value of your investment declines as well - nasty. For the purpose of this article, we only scrutinise the last decade of RGC Resources's dividend payments. During this period the dividend has been stable, which could imply the business could have relatively consistent earnings power. During the past ten-year period, the first annual payment was US$0.43 in 2010, compared to US$0.70 last year. Dividends per share have grown at approximately 5.1% per year over this time.
Businesses that can grow their dividends at a decent rate and maintain a stable payout can generate substantial wealth for shareholders over the long term.
Dividend Growth Potential
Dividend payments have been consistent over the past few years, but we should always check if earnings per share (EPS) are growing, as this will help maintain the purchasing power of the dividend. Strong earnings per share (EPS) growth might encourage our interest in the company despite fluctuating dividends, which is why it's great to see RGC Resources has grown its earnings per share at 14% per annum over the past five years. RGC Resources's earnings per share have grown rapidly in recent years, although more than half of its profits are being paid out as dividends, which makes us wonder if the company has a limited number of reinvestment opportunities in its business.
Conclusion
To summarise, shareholders should always check that RGC Resources's dividends are affordable, that its dividend payments are relatively stable, and that it has decent prospects for growing its earnings and dividend. First, the company has a payout ratio that was within an average range for most dividend stocks, but it paid out virtually all of its generated cash flow. That said, we were glad to see it growing earnings and paying a fairly consistent dividend. While we're not hugely bearish on it, overall we think there are potentially better dividend stocks than RGC Resources out there.
Companies possessing a stable dividend policy will likely enjoy greater investor interest than those suffering from a more inconsistent approach. Meanwhile, despite the importance of dividend payments, they are not the only factors our readers should know when assessing a company. Case in point: We've spotted 2 warning signs for RGC Resources (of which 1 is a bit concerning!) you should know about.
If you are a dividend investor, you might also want to look at our curated list of dividend stocks yielding above 3%.
If you spot an error that warrants correction, please contact the editor at editorial-team@simplywallst.com. This article by Simply Wall St is general in nature. It does not constitute a recommendation to buy or sell any stock, and does not take account of your objectives, or your financial situation. Simply Wall St has no position in the stocks mentioned.
We aim to bring you long-term focused research analysis driven by fundamental data. Note that our analysis may not factor in the latest price-sensitive company announcements or qualitative material. Thank you for reading.
