Should Rocky Mountain Dealerships Inc. (TSE:RME) Be Part Of Your Dividend Portfolio?

Could Rocky Mountain Dealerships Inc. (TSE:RME) be an attractive dividend share to own for the long haul? Investors are often drawn to strong companies with the idea of reinvesting the dividends. Yet sometimes, investors buy a popular dividend stock because of its yield, and then lose money if the company's dividend doesn't live up to expectations.
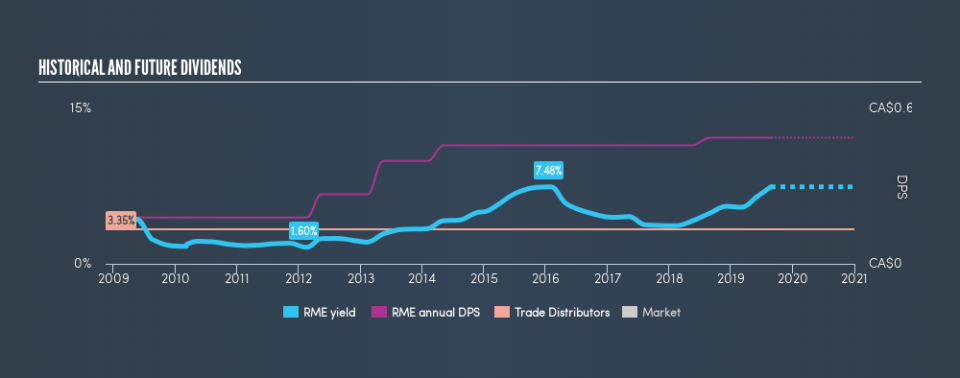
With Rocky Mountain Dealerships yielding 7.5% and having paid a dividend for over 10 years, many investors likely find the company quite interesting. We'd guess that plenty of investors have purchased it for the income. The company also bought back stock equivalent to around 4.6% of market capitalisation this year. When buying stocks for their dividends, you should always run through the checks below, to see if the dividend looks sustainable.
Click the interactive chart for our full dividend analysis
Payout ratios
Dividends are typically paid from company earnings. If a company pays more in dividends than it earned, then the dividend might become unsustainable - hardly an ideal situation. As a result, we should always investigate whether a company can afford its dividend, measured as a percentage of a company's net income after tax. Looking at the data, we can see that 95% of Rocky Mountain Dealerships's profits were paid out as dividends in the last 12 months. With a payout ratio this high, we'd say its dividend is not well covered by earnings. This may be fine if earnings are growing, but it might not take much of a downturn for the dividend to come under pressure.
In addition to comparing dividends against profits, we should inspect whether the company generated enough cash to pay its dividend. Rocky Mountain Dealerships's cash payout ratio in the last year was 33%, which suggests dividends were well covered by cash generated by the business. While the dividend was not well covered by profits, at least they were covered by free cash flow. Still, if the company continues paying out such a high percentage of its profits, the dividend could be at risk if business turns sour.
Is Rocky Mountain Dealerships's Balance Sheet Risky?
As Rocky Mountain Dealerships's dividend was not well covered by earnings, we need to check its balance sheet for signs of financial distress. A quick check of its financial situation can be done with two ratios: net debt divided by EBITDA (earnings before interest, tax, depreciation and amortisation), and net interest cover. Net debt to EBITDA measures total debt load relative to company earnings (lower = less debt), while net interest cover measures the ability to pay interest on the debt (higher = greater ability to pay interest costs). Rocky Mountain Dealerships has net debt of 12.14 times its EBITDA, which we think carries substantial risk if earnings aren't sustainable.
Net interest cover can be calculated by dividing earnings before interest and tax (EBIT) by the company's net interest expense. Interest cover of 2.12 times its interest expense is starting to become a concern for Rocky Mountain Dealerships, and be aware that lenders may place additional restrictions on the company as well. Low interest cover and high debt can create problems right when the investor least needs them, and we're reluctant to rely on the dividend of companies with these traits.
We update our data on Rocky Mountain Dealerships every 24 hours, so you can always get our latest analysis of its financial health, here.
Dividend Volatility
One of the major risks of relying on dividend income, is the potential for a company to struggle financially and cut its dividend. Not only is your income cut, but the value of your investment declines as well - nasty. For the purpose of this article, we only scrutinise the last decade of Rocky Mountain Dealerships's dividend payments. The dividend has been stable over the past 10 years, which is great. We think this could suggest some resilience to the business and its dividends. During the past ten-year period, the first annual payment was CA$0.18 in 2009, compared to CA$0.49 last year. This works out to be a compound annual growth rate (CAGR) of approximately 11% a year over that time.
With rapid dividend growth and no notable cuts to the dividend over a lengthy period of time, we think this company has a lot going for it.
Dividend Growth Potential
While dividend payments have been relatively reliable, it would also be nice if earnings per share (EPS) were growing, as this is essential to maintaining the dividend's purchasing power over the long term. It's not great to see that Rocky Mountain Dealerships's have fallen at approximately 8.4% over the past five years. A modest decline in earnings per share is not great to see, but it doesn't automatically make a dividend unsustainable. Still, we'd vastly prefer to see EPS growth when researching dividend stocks.
Conclusion
When we look at a dividend stock, we need to form a judgement on whether the dividend will grow, if the company is able to maintain it in a wide range of economic circumstances, and if the dividend payout is sustainable. We're not keen on the fact that Rocky Mountain Dealerships paid out such a high percentage of its income, although its cashflow is in better shape. Earnings per share have not been growing, but we respect a company that maintains a relatively stable dividend. While we're not hugely bearish on it, overall we think there are potentially better dividend stocks than Rocky Mountain Dealerships out there.
Given that earnings are not growing, the dividend does not look nearly so attractive. See if the 5 analysts are forecasting a turnaround in our free collection of analyst estimates here.
Looking for more high-yielding dividend ideas? Try our curated list of dividend stocks with a yield above 3%.
We aim to bring you long-term focused research analysis driven by fundamental data. Note that our analysis may not factor in the latest price-sensitive company announcements or qualitative material.
If you spot an error that warrants correction, please contact the editor at editorial-team@simplywallst.com. This article by Simply Wall St is general in nature. It does not constitute a recommendation to buy or sell any stock, and does not take account of your objectives, or your financial situation. Simply Wall St has no position in the stocks mentioned. Thank you for reading.
