With An ROE Of 12.80%, Has Lancashire Holdings Limited’s (LSE:LRE) Management Done A Good Job?

Lancashire Holdings Limited (LSE:LRE) generated a below-average return on equity of 12.80% in the past 12 months, while its industry returned 15.84%. Though LRE’s recent performance is underwhelming, it is useful to understand what ROE is made up of and how it should be interpreted. Knowing these components can change your views on LRE’s below-average returns. Today I will look at how components such as financial leverage can influence ROE which may impact the sustainability of LRE’s returns. Check out our latest analysis for Lancashire Holdings
Breaking down ROE — the mother of all ratios
Firstly, Return on Equity, or ROE, is simply the percentage of last years’ earning against the book value of shareholders’ equity. It essentially shows how much LRE can generate in earnings given the amount of equity it has raised. While a higher ROE is preferred in most cases, there are several other factors we should consider before drawing any conclusions.
Return on Equity = Net Profit ÷ Shareholders Equity
ROE is measured against cost of equity in order to determine the efficiency of LRE’s equity capital deployed. Its cost of equity is 8.30%. While LRE’s peers may have higher ROE, it may also incur higher cost of equity. An undesirable and unsustainable practice would be if returns exceeded cost. However, this is not the case for LRE which is encouraging. ROE can be dissected into three distinct ratios: net profit margin, asset turnover, and financial leverage. This is called the Dupont Formula:
Dupont Formula
ROE = profit margin × asset turnover × financial leverage
ROE = (annual net profit ÷ sales) × (sales ÷ assets) × (assets ÷ shareholders’ equity)
ROE = annual net profit ÷ shareholders’ equity

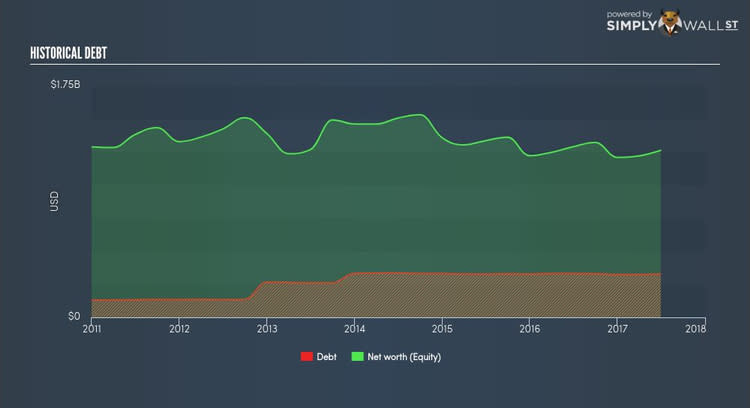
The first component is profit margin, which measures how much of sales is retained after the company pays for all its expenses. Asset turnover reveals how much revenue can be generated from LRE’s asset base. The most interesting ratio, and reflective of sustainability of its ROE, is financial leverage. Since financial leverage can artificially inflate ROE, we need to look at how much debt LRE currently has. The debt-to-equity ratio currently stands at a low 25.96%, meaning LRE still has headroom to borrow debt to increase profits.
What this means for you:
Are you a shareholder? While LRE exhibits a weak ROE against its peers, its returns are sufficient enough to cover its cost of equity, which means its generating value for shareholders. Since its high ROE is not likely driven by high debt, it might be a good time to top up on your current holdings if your fundamental research reaffirms this analysis. If you’re looking for new ideas for high-returning stocks, you should take a look at our free platform to see the list of stocks with Return on Equity over 20%.
Are you a potential investor? If LRE has been on your watch list for a while, making an investment decision based on ROE alone is unwise. I recommend you do additional fundamental analysis by looking through our most recent infographic report on Lancashire Holdings to help you make a more informed investment decision.
To help readers see pass the short term volatility of the financial market, we aim to bring you a long-term focused research analysis purely driven by fundamental data. Note that our analysis does not factor in the latest price sensitive company announcements.
The author is an independent contributor and at the time of publication had no position in the stocks mentioned.
