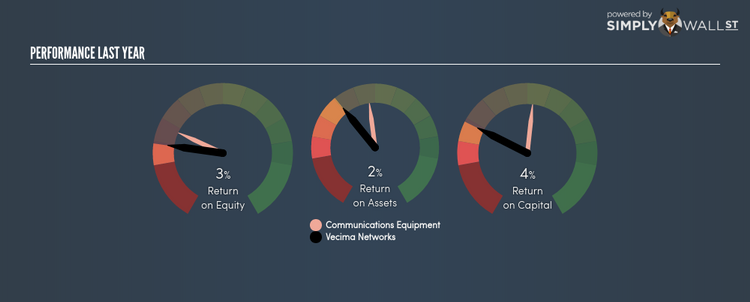
With An ROE Of 2.88%, Has Vecima Networks Inc’s (TSX:VCM) Management Done A Good Job?

Vecima Networks Inc’s (TSX:VCM) most recent return on equity was a substandard 2.88% relative to its industry performance of 5.52% over the past year. An investor may attribute an inferior ROE to a relatively inefficient performance, and whilst this can often be the case, knowing the nuts and bolts of the ROE calculation may change that perspective and give you a deeper insight into VCM’s past performance. Metrics such as financial leverage can impact the level of ROE which in turn can affect the sustainability of VCM’s returns. Let me show you what I mean by this. Check out our latest analysis for Vecima Networks
Breaking down Return on Equity
Return on Equity (ROE) is a measure of VCM’s profit relative to its shareholders’ equity. An ROE of 2.88% implies CA$0.03 returned on every CA$1 invested. While a higher ROE is preferred in most cases, there are several other factors we should consider before drawing any conclusions.
Return on Equity = Net Profit ÷ Shareholders Equity
ROE is measured against cost of equity in order to determine the efficiency of VCM’s equity capital deployed. Its cost of equity is 13.56%. Since VCM’s return does not cover its cost, with a difference of -10.68%, this means its current use of equity is not efficient and not sustainable. Very simply, VCM pays more for its capital than what it generates in return. ROE can be broken down into three different ratios: net profit margin, asset turnover, and financial leverage. This is called the Dupont Formula:
Dupont Formula
ROE = profit margin × asset turnover × financial leverage
ROE = (annual net profit ÷ sales) × (sales ÷ assets) × (assets ÷ shareholders’ equity)
ROE = annual net profit ÷ shareholders’ equity
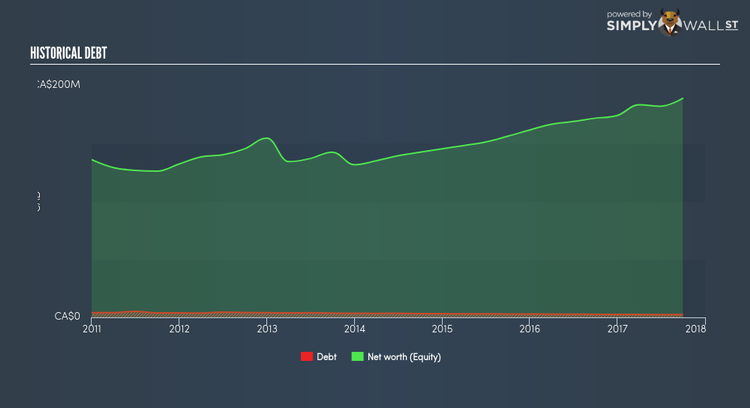
The first component is profit margin, which measures how much of sales is retained after the company pays for all its expenses. The other component, asset turnover, illustrates how much revenue VCM can make from its asset base. The most interesting ratio, and reflective of sustainability of its ROE, is financial leverage. Since ROE can be artificially increased through excessive borrowing, we should check VCM’s historic debt-to-equity ratio. At 1.28%, VCM’s debt-to-equity ratio appears low and indicates that VCM still has room to increase leverage and grow its profits.
What this means for you:
Are you a shareholder? VCM’s ROE is underwhelming relative to the industry average, and its returns were also not strong enough to cover its own cost of equity. Since its existing ROE is not fuelled by unsustainable debt, investors shouldn’t give up as VCM still has capacity to improve shareholder returns by borrowing to invest in new projects in the future. If you’re looking for new ideas for high-returning stocks, you should take a look at our free platform to see the list of stocks with Return on Equity over 20%.
Are you a potential investor? If VCM has been on your watch list for a while, making an investment decision based on ROE alone is unwise. I recommend you do additional fundamental analysis by looking through our most recent infographic report on Vecima Networks to help you make a more informed investment decision.
To help readers see pass the short term volatility of the financial market, we aim to bring you a long-term focused research analysis purely driven by fundamental data. Note that our analysis does not factor in the latest price sensitive company announcements.
The author is an independent contributor and at the time of publication had no position in the stocks mentioned.
