With An ROE Of 3.63%, Can The Madison Square Garden Company (NYSE:MSG) Catch Up To The Industry?

The content of this article will benefit those of you who are starting to educate yourself about investing in the stock market and want to better understand how you can grow your money by investing in The Madison Square Garden Company (NYSE:MSG).
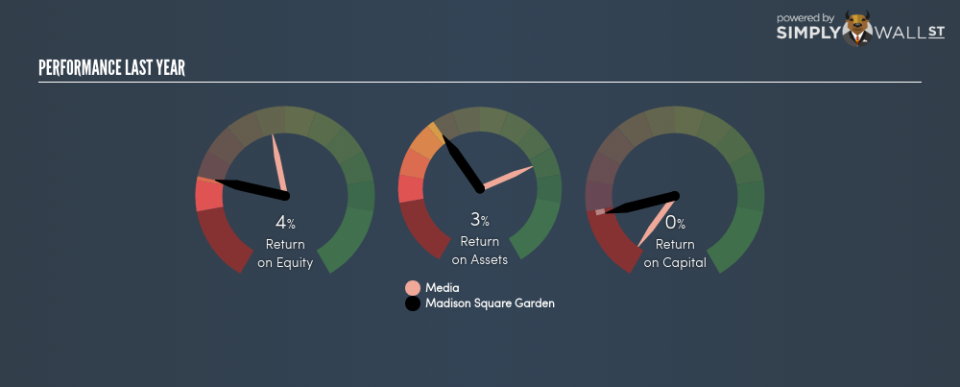
The Madison Square Garden Company’s (NYSE:MSG) most recent return on equity was a substandard 3.63% relative to its industry performance of 14.11% over the past year. MSG’s results could indicate a relatively inefficient operation to its peers, and while this may be the case, it is important to understand what ROE is made up of and how it should be interpreted. Knowing these components could change your view on MSG’s performance. Metrics such as financial leverage can impact the level of ROE which in turn can affect the sustainability of MSG’s returns. Let me show you what I mean by this. Check out our latest analysis for Madison Square Garden
Breaking down ROE — the mother of all ratios
Return on Equity (ROE) weighs Madison Square Garden’s profit against the level of its shareholders’ equity. An ROE of 3.63% implies $0.036 returned on every $1 invested. Generally speaking, a higher ROE is preferred; however, there are other factors we must also consider before making any conclusions.
Return on Equity = Net Profit ÷ Shareholders Equity
ROE is measured against cost of equity in order to determine the efficiency of Madison Square Garden’s equity capital deployed. Its cost of equity is 8.84%. Given a discrepancy of -5.21% between return and cost, this indicated that Madison Square Garden may be paying more for its capital than what it’s generating in return. ROE can be split up into three useful ratios: net profit margin, asset turnover, and financial leverage. This is called the Dupont Formula:
Dupont Formula
ROE = profit margin × asset turnover × financial leverage
ROE = (annual net profit ÷ sales) × (sales ÷ assets) × (assets ÷ shareholders’ equity)
ROE = annual net profit ÷ shareholders’ equity
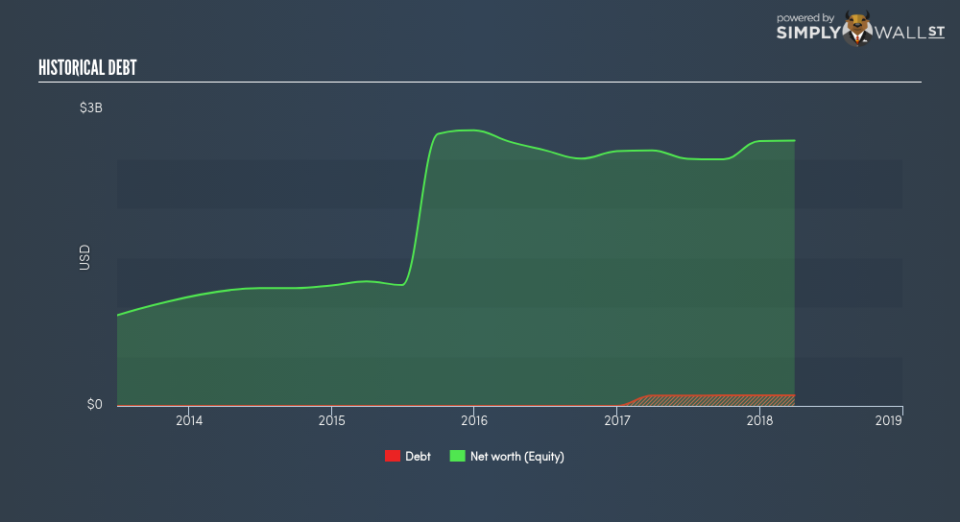
Basically, profit margin measures how much of revenue trickles down into earnings which illustrates how efficient the business is with its cost management. Asset turnover reveals how much revenue can be generated from Madison Square Garden’s asset base. And finally, financial leverage is simply how much of assets are funded by equity, which exhibits how sustainable the company’s capital structure is. Since ROE can be inflated by excessive debt, we need to examine Madison Square Garden’s debt-to-equity level. The debt-to-equity ratio currently stands at a low 3.95%, meaning Madison Square Garden still has headroom to borrow debt to increase profits.
Next Steps:
ROE is one of many ratios which meaningfully dissects financial statements, which illustrates the quality of a company. Madison Square Garden’s ROE is underwhelming relative to the industry average, and its returns were also not strong enough to cover its own cost of equity. However, ROE is not likely to be inflated by excessive debt funding, giving shareholders more conviction in the sustainability of returns, which has headroom to increase further. ROE is a helpful signal, but it is definitely not sufficient on its own to make an investment decision.
For Madison Square Garden, there are three essential aspects you should look at:
Financial Health: Does it have a healthy balance sheet? Take a look at our free balance sheet analysis with six simple checks on key factors like leverage and risk.
Valuation: What is Madison Square Garden worth today? Is the stock undervalued, even when its growth outlook is factored into its intrinsic value? The intrinsic value infographic in our free research report helps visualize whether Madison Square Garden is currently mispriced by the market.
Other High-Growth Alternatives : Are there other high-growth stocks you could be holding instead of Madison Square Garden? Explore our interactive list of stocks with large growth potential to get an idea of what else is out there you may be missing!
To help readers see pass the short term volatility of the financial market, we aim to bring you a long-term focused research analysis purely driven by fundamental data. Note that our analysis does not factor in the latest price sensitive company announcements.
The author is an independent contributor and at the time of publication had no position in the stocks mentioned.
