With An ROE Of 3.71%, Has BOS Better Online Solutions Ltd’s (BOSC) Management Done A Good Job?

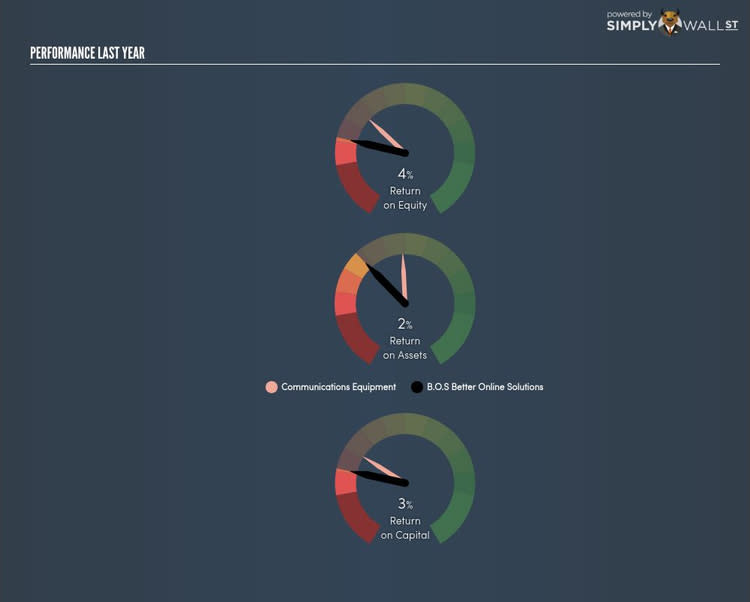
BOS Better Online Solutions Ltd (NASDAQ:BOSC) delivered a less impressive 3.71% ROE over the past year, compared to the 8.50% return generated by its industry. BOSC's results could indicate a relatively inefficient operation to its peers, and while this may be the case, it is important to understand what ROE is made up of and how it should be interpreted. Knowing these components could change your view on BOSC’s performance. I will take you through how metrics such as financial leverage impact ROE which may affect the overall sustainability of BOSC's returns. View our latest analysis for B.O.S Better Online Solutions
What you must know about ROE
Return on Equity (ROE) weighs BOSC’s profit against the level of its shareholders’ equity. An ROE of 3.71% implies $0.04 returned on every $1 invested. In most cases, a higher ROE is preferred; however, there are many other factors we must consider prior to making any investment decisions.
Return on Equity = Net Profit ÷ Shareholders Equity
ROE is assessed against cost of equity, which is measured using the Capital Asset Pricing Model (CAPM) – but let’s not dive into the details of that today. For now, let’s just look at the cost of equity number for BOSC, which is 10.19%. Given a discrepancy of -6.48% between return and cost, this indicated that BOSC may be paying more for its capital than what it’s generating in return. ROE can be split up into three useful ratios: net profit margin, asset turnover, and financial leverage. This is called the Dupont Formula:
Dupont Formula
ROE = profit margin × asset turnover × financial leverage
ROE = (annual net profit ÷ sales) × (sales ÷ assets) × (assets ÷ shareholders’ equity)
ROE = annual net profit ÷ shareholders’ equity
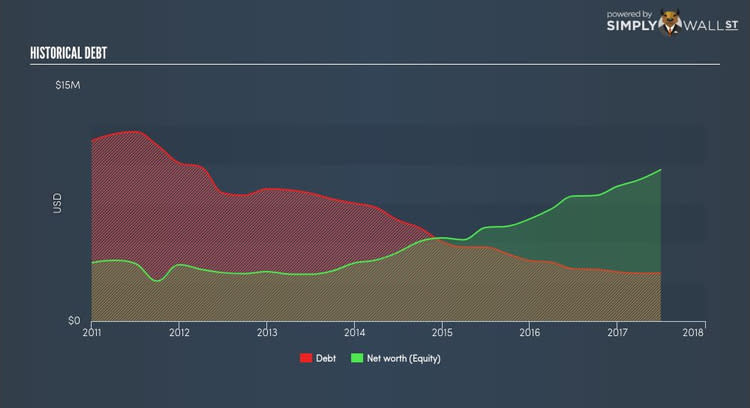
Essentially, profit margin shows how much money the company makes after paying for all its expenses. The other component, asset turnover, illustrates how much revenue BOSC can make from its asset base. The most interesting ratio, and reflective of sustainability of its ROE, is financial leverage. Since financial leverage can artificially inflate ROE, we need to look at how much debt BOSC currently has. At 31.69%, BOSC’s debt-to-equity ratio appears low and indicates that BOSC still has room to increase leverage and grow its profits.
What this means for you:
Are you a shareholder? BOSC’s below-industry ROE is disappointing, furthermore, its returns were not even high enough to cover its own cost of equity. Since its existing ROE is not fuelled by unsustainable debt, investors shouldn’t give up as BOSC still has capacity to improve shareholder returns by borrowing to invest in new projects in the future. If you're looking for new ideas for high-returning stocks, you should take a look at our free platform to see the list of stocks with Return on Equity over 20%.
Are you a potential investor? If you are considering investing in BOSC, looking at ROE on its own is not enough to make a well-informed decision. I recommend you do additional fundamental analysis by looking through our most recent infographic report on B.O.S Better Online Solutions to help you make a more informed investment decision.
To help readers see pass the short term volatility of the financial market, we aim to bring you a long-term focused research analysis purely driven by fundamental data. Note that our analysis does not factor in the latest price sensitive company announcements.
The author is an independent contributor and at the time of publication had no position in the stocks mentioned.
