With An ROE Of 33.79%, Has AAC Technologies Holdings Inc’s (HKG:2018) Management Done Well?

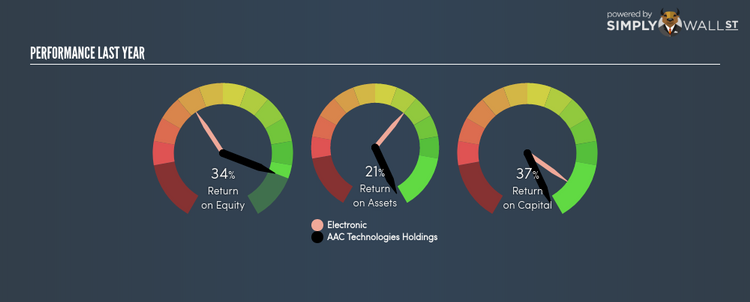
AAC Technologies Holdings Inc (SEHK:2018) delivered an ROE of 33.79% over the past 12 months, which is an impressive feat relative to its industry average of 10.71% during the same period. While the impressive ratio tells us that 2018 has made significant profits from little equity capital, ROE doesn’t tell us if 2018 has borrowed debt to make this happen. We’ll take a closer look today at factors like financial leverage to determine whether 2018’s ROE is actually sustainable. View our latest analysis for AAC Technologies Holdings
Breaking down ROE — the mother of all ratios
Return on Equity (ROE) is a measure of AAC Technologies Holdings’s profit relative to its shareholders’ equity. For example, if the company invests HK$1 in the form of equity, it will generate HK$0.34 in earnings from this. Generally speaking, a higher ROE is preferred; however, there are other factors we must also consider before making any conclusions.
Return on Equity = Net Profit ÷ Shareholders Equity
ROE is measured against cost of equity in order to determine the efficiency of AAC Technologies Holdings’s equity capital deployed. Its cost of equity is 8.49%. This means AAC Technologies Holdings returns enough to cover its own cost of equity, with a buffer of 25.30%. This sustainable practice implies that the company pays less for its capital than what it generates in return. ROE can be dissected into three distinct ratios: net profit margin, asset turnover, and financial leverage. This is called the Dupont Formula:
Dupont Formula
ROE = profit margin × asset turnover × financial leverage
ROE = (annual net profit ÷ sales) × (sales ÷ assets) × (assets ÷ shareholders’ equity)
ROE = annual net profit ÷ shareholders’ equity
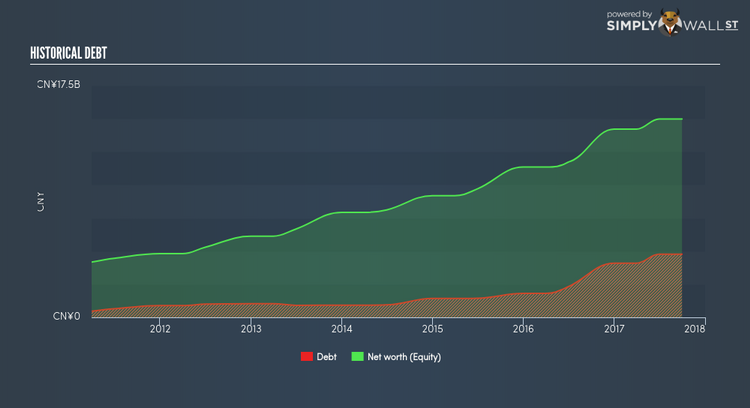
Essentially, profit margin shows how much money the company makes after paying for all its expenses. Asset turnover shows how much revenue AAC Technologies Holdings can generate with its current asset base. Finally, financial leverage will be our main focus today. It shows how much of assets are funded by equity and can show how sustainable the company’s capital structure is. Since ROE can be artificially increased through excessive borrowing, we should check AAC Technologies Holdings’s historic debt-to-equity ratio. Currently the debt-to-equity ratio stands at a low 31.82%, which means its above-average ROE is driven by its ability to grow its profit without a significant debt burden.
Next Steps:
While ROE is a relatively simple calculation, it can be broken down into different ratios, each telling a different story about the strengths and weaknesses of a company. AAC Technologies Holdings’s ROE is impressive relative to the industry average and also covers its cost of equity. ROE is not likely to be inflated by excessive debt funding, giving shareholders more conviction in the sustainability of high returns. ROE is a helpful signal, but it is definitely not sufficient on its own to make an investment decision.
For AAC Technologies Holdings, I’ve compiled three pertinent factors you should look at:
Financial Health: Does it have a healthy balance sheet? Take a look at our free balance sheet analysis with six simple checks on key factors like leverage and risk.
Valuation: What is AAC Technologies Holdings worth today? Is the stock undervalued, even when its growth outlook is factored into its intrinsic value? The intrinsic value infographic in our free research report helps visualize whether AAC Technologies Holdings is currently mispriced by the market.
Other High-Growth Alternatives : Are there other high-growth stocks you could be holding instead of AAC Technologies Holdings? Explore our interactive list of stocks with large growth potential to get an idea of what else is out there you may be missing!
To help readers see pass the short term volatility of the financial market, we aim to bring you a long-term focused research analysis purely driven by fundamental data. Note that our analysis does not factor in the latest price sensitive company announcements.
The author is an independent contributor and at the time of publication had no position in the stocks mentioned.
