With An ROE Of 57.0%, Has Armstrong World Industries Inc’s (NYSE:AWI) Management Done Well?

This article is intended for those of you who are at the beginning of your investing journey and want to start learning about core concepts of fundamental analysis on practical examples from today’s market.
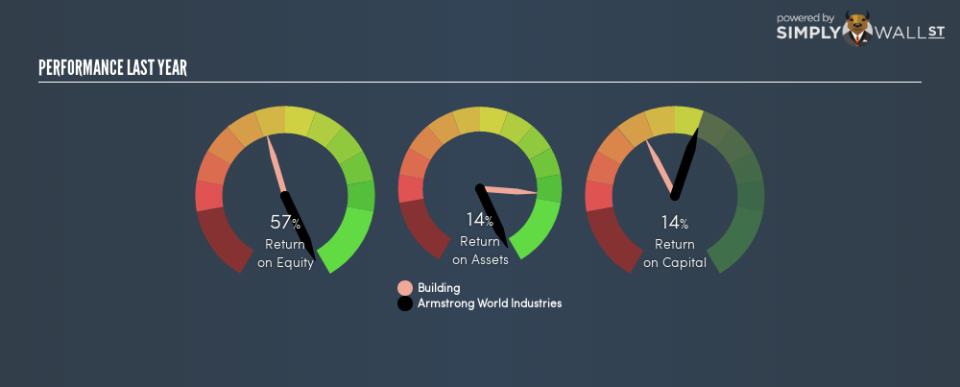
Armstrong World Industries Inc (NYSE:AWI) delivered an ROE of 57.0% over the past 12 months, which is an impressive feat relative to its industry average of 13.4% during the same period. Superficially, this looks great since we know that AWI has generated big profits with little equity capital; however, ROE doesn’t tell us how much AWI has borrowed in debt. We’ll take a closer look today at factors like financial leverage to determine whether AWI’s ROE is actually sustainable.
View our latest analysis for Armstrong World Industries
Breaking down ROE — the mother of all ratios
Return on Equity (ROE) is a measure of Armstrong World Industries’s profit relative to its shareholders’ equity. For example, if the company invests $1 in the form of equity, it will generate $0.57 in earnings from this. In most cases, a higher ROE is preferred; however, there are many other factors we must consider prior to making any investment decisions.
Return on Equity = Net Profit ÷ Shareholders Equity
Returns are usually compared to costs to measure the efficiency of capital. Armstrong World Industries’s cost of equity is 12.2%. Given a positive discrepancy of 44.8% between return and cost, this indicates that Armstrong World Industries pays less for its capital than what it generates in return, which is a sign of capital efficiency. ROE can be dissected into three distinct ratios: net profit margin, asset turnover, and financial leverage. This is called the Dupont Formula:
Dupont Formula
ROE = profit margin × asset turnover × financial leverage
ROE = (annual net profit ÷ sales) × (sales ÷ assets) × (assets ÷ shareholders’ equity)
ROE = annual net profit ÷ shareholders’ equity
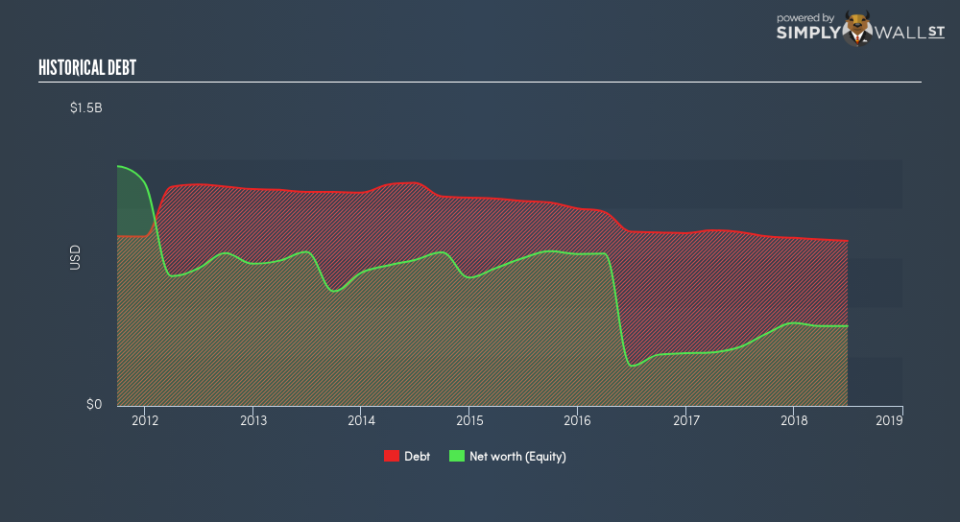
The first component is profit margin, which measures how much of sales is retained after the company pays for all its expenses. The other component, asset turnover, illustrates how much revenue Armstrong World Industries can make from its asset base. And finally, financial leverage is simply how much of assets are funded by equity, which exhibits how sustainable the company’s capital structure is. Since ROE can be artificially increased through excessive borrowing, we should check Armstrong World Industries’s historic debt-to-equity ratio. The debt-to-equity ratio currently stands at a high 207%, meaning the above-average ratio is a result of a large amount of debt.
Next Steps:
ROE is a simple yet informative ratio, illustrating the various components that each measure the quality of the overall stock. Armstrong World Industries’s ROE is impressive relative to the industry average and also covers its cost of equity. With debt capital in excess of equity, ROE may be inflated by the use of debt funding, raising questions over the sustainability of the company’s returns. Although ROE can be a useful metric, it is only a small part of diligent research.
For Armstrong World Industries, there are three relevant factors you should further research:
Financial Health: Does it have a healthy balance sheet? Take a look at our free balance sheet analysis with six simple checks on key factors like leverage and risk.
Valuation: What is Armstrong World Industries worth today? Is the stock undervalued, even when its growth outlook is factored into its intrinsic value? The intrinsic value infographic in our free research report helps visualize whether Armstrong World Industries is currently mispriced by the market.
Other High-Growth Alternatives : Are there other high-growth stocks you could be holding instead of Armstrong World Industries? Explore our interactive list of stocks with large growth potential to get an idea of what else is out there you may be missing!
To help readers see past the short term volatility of the financial market, we aim to bring you a long-term focused research analysis purely driven by fundamental data. Note that our analysis does not factor in the latest price-sensitive company announcements.
The author is an independent contributor and at the time of publication had no position in the stocks mentioned. For errors that warrant correction please contact the editor at editorial-team@simplywallst.com.
