With An ROE Of 73.13%, Has Rentokil Initial plc’s (LON:RTO) Management Done Well?

I am writing today to help inform people who are new to the stock market and want to better understand how you can grow your money by investing in Rentokil Initial plc (LON:RTO).
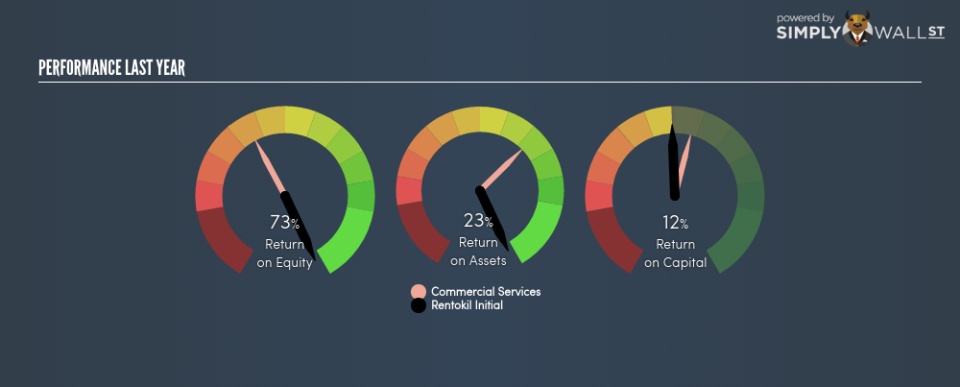
Rentokil Initial plc (LON:RTO) delivered an ROE of 73.13% over the past 12 months, which is an impressive feat relative to its industry average of 11.49% during the same period. While the impressive ratio tells us that RTO has made significant profits from little equity capital, ROE doesn’t tell us if RTO has borrowed debt to make this happen. We’ll take a closer look today at factors like financial leverage to determine whether RTO’s ROE is actually sustainable. View out our latest analysis for Rentokil Initial
What you must know about ROE
Return on Equity (ROE) is a measure of Rentokil Initial’s profit relative to its shareholders’ equity. For example, if the company invests £1 in the form of equity, it will generate £0.73 in earnings from this. In most cases, a higher ROE is preferred; however, there are many other factors we must consider prior to making any investment decisions.
Return on Equity = Net Profit ÷ Shareholders Equity
ROE is assessed against cost of equity, which is measured using the Capital Asset Pricing Model (CAPM) – but let’s not dive into the details of that today. For now, let’s just look at the cost of equity number for Rentokil Initial, which is 8.28%. Since Rentokil Initial’s return covers its cost in excess of 64.85%, its use of equity capital is efficient and likely to be sustainable. Simply put, Rentokil Initial pays less for its capital than what it generates in return. ROE can be broken down into three different ratios: net profit margin, asset turnover, and financial leverage. This is called the Dupont Formula:
Dupont Formula
ROE = profit margin × asset turnover × financial leverage
ROE = (annual net profit ÷ sales) × (sales ÷ assets) × (assets ÷ shareholders’ equity)
ROE = annual net profit ÷ shareholders’ equity
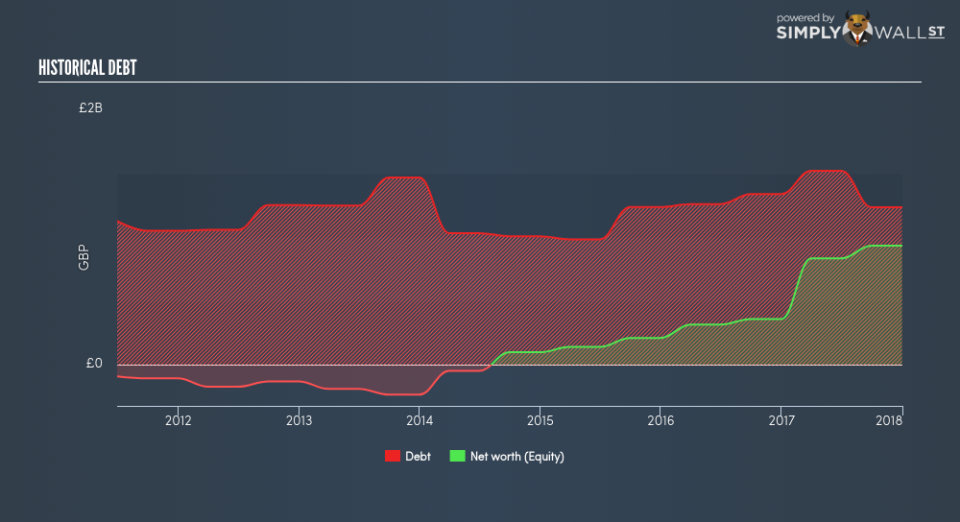
Essentially, profit margin shows how much money the company makes after paying for all its expenses. Asset turnover reveals how much revenue can be generated from Rentokil Initial’s asset base. The most interesting ratio, and reflective of sustainability of its ROE, is financial leverage. Since financial leverage can artificially inflate ROE, we need to look at how much debt Rentokil Initial currently has. The debt-to-equity ratio currently stands at a balanced 132.22%, meaning the above-average ROE is due to its capacity to produce profit growth without a huge debt burden.
Next Steps:
ROE is one of many ratios which meaningfully dissects financial statements, which illustrates the quality of a company. Rentokil Initial’s above-industry ROE is encouraging, and is also in excess of its cost of equity. Its high ROE is not likely to be driven by high debt. Therefore, investors may have more confidence in the sustainability of this level of returns going forward. Although ROE can be a useful metric, it is only a small part of diligent research.
For Rentokil Initial, I’ve put together three relevant factors you should further examine:
Financial Health: Does it have a healthy balance sheet? Take a look at our free balance sheet analysis with six simple checks on key factors like leverage and risk.
Valuation: What is Rentokil Initial worth today? Is the stock undervalued, even when its growth outlook is factored into its intrinsic value? The intrinsic value infographic in our free research report helps visualize whether Rentokil Initial is currently mispriced by the market.
Other High-Growth Alternatives : Are there other high-growth stocks you could be holding instead of Rentokil Initial? Explore our interactive list of stocks with large growth potential to get an idea of what else is out there you may be missing!
To help readers see pass the short term volatility of the financial market, we aim to bring you a long-term focused research analysis purely driven by fundamental data. Note that our analysis does not factor in the latest price sensitive company announcements.
The author is an independent contributor and at the time of publication had no position in the stocks mentioned.
