With An ROE Of 9.3%, Has Interlink Electronics Inc’s (NASDAQ:LINK) Management Done Well?

This analysis is intended to introduce important early concepts to people who are starting to invest and want to learn about Return on Equity using a real-life example.
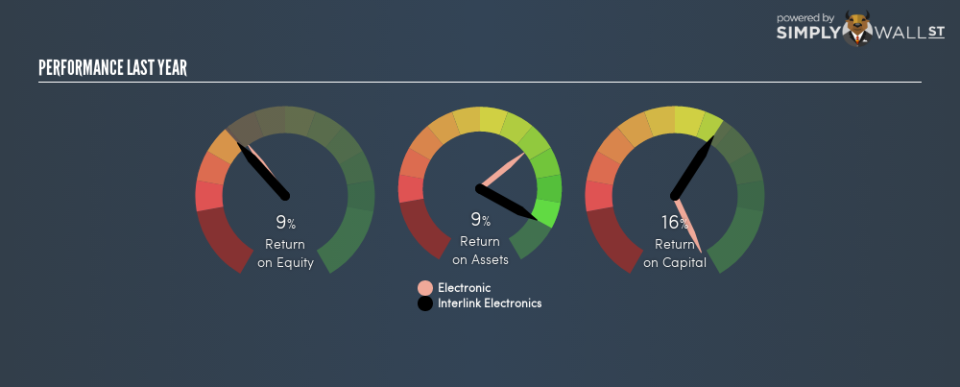
Interlink Electronics Inc (NASDAQ:LINK) generated a below-average return on equity of 9.3% in the past 12 months, while its industry returned 10.2%. LINK’s results could indicate a relatively inefficient operation to its peers, and while this may be the case, it is important to understand what ROE is made up of and how it should be interpreted. Knowing these components could change your view on LINK’s performance. I will take you through how metrics such as financial leverage impact ROE which may affect the overall sustainability of LINK’s returns.
See our latest analysis for Interlink Electronics
What you must know about ROE
Return on Equity (ROE) is a measure of Interlink Electronics’s profit relative to its shareholders’ equity. An ROE of 9.3% implies $0.093 returned on every $1 invested. Generally speaking, a higher ROE is preferred; however, there are other factors we must also consider before making any conclusions.
Return on Equity = Net Profit ÷ Shareholders Equity
ROE is measured against cost of equity in order to determine the efficiency of Interlink Electronics’s equity capital deployed. Its cost of equity is 10.2%. This means Interlink Electronics’s returns actually do not cover its own cost of equity, with a discrepancy of -0.9%. This isn’t sustainable as it implies, very simply, that the company pays more for its capital than what it generates in return. ROE can be dissected into three distinct ratios: net profit margin, asset turnover, and financial leverage. This is called the Dupont Formula:
Dupont Formula
ROE = profit margin × asset turnover × financial leverage
ROE = (annual net profit ÷ sales) × (sales ÷ assets) × (assets ÷ shareholders’ equity)
ROE = annual net profit ÷ shareholders’ equity
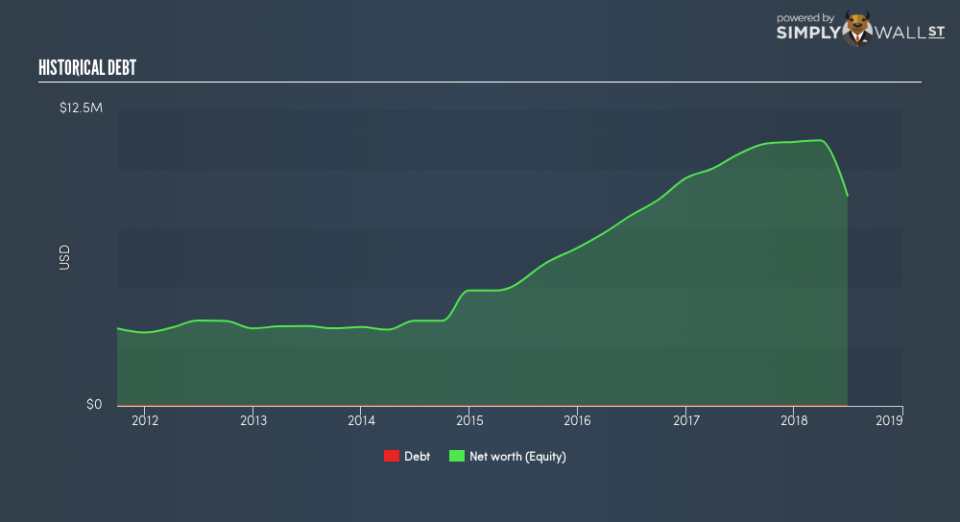
Basically, profit margin measures how much of revenue trickles down into earnings which illustrates how efficient the business is with its cost management. Asset turnover reveals how much revenue can be generated from Interlink Electronics’s asset base. Finally, financial leverage will be our main focus today. It shows how much of assets are funded by equity and can show how sustainable the company’s capital structure is. Since financial leverage can artificially inflate ROE, we need to look at how much debt Interlink Electronics currently has. Currently, Interlink Electronics has no debt which means its returns are driven purely by equity capital. This could explain why Interlink Electronics’s’ ROE is lower than its industry peers, most of which may have some degree of debt in its business.
Next Steps:
ROE is a simple yet informative ratio, illustrating the various components that each measure the quality of the overall stock. Interlink Electronics exhibits a weak ROE against its peers, as well as insufficient levels to cover its own cost of equity this year. Although, its appropriate level of leverage means investors can be more confident in the sustainability of Interlink Electronics’s return with a possible increase should the company decide to increase its debt levels. Although ROE can be a useful metric, it is only a small part of diligent research.
For Interlink Electronics, there are three pertinent factors you should look at:
Financial Health: Does it have a healthy balance sheet? Take a look at our free balance sheet analysis with six simple checks on key factors like leverage and risk.
Valuation: What is Interlink Electronics worth today? Is the stock undervalued, even when its growth outlook is factored into its intrinsic value? The intrinsic value infographic in our free research report helps visualize whether Interlink Electronics is currently mispriced by the market.
Other High-Growth Alternatives : Are there other high-growth stocks you could be holding instead of Interlink Electronics? Explore our interactive list of stocks with large growth potential to get an idea of what else is out there you may be missing!
To help readers see past the short term volatility of the financial market, we aim to bring you a long-term focused research analysis purely driven by fundamental data. Note that our analysis does not factor in the latest price-sensitive company announcements.
The author is an independent contributor and at the time of publication had no position in the stocks mentioned. For errors that warrant correction please contact the editor at editorial-team@simplywallst.com.
