With An ROE Of 9.77%, Has innogy SE’s (FRA:IGY) Management Done Well?

The content of this article will benefit those of you who are starting to educate yourself about investing in the stock market and want to begin learning the link between innogy SE (FRA:IGY)’s return fundamentals and stock market performance.
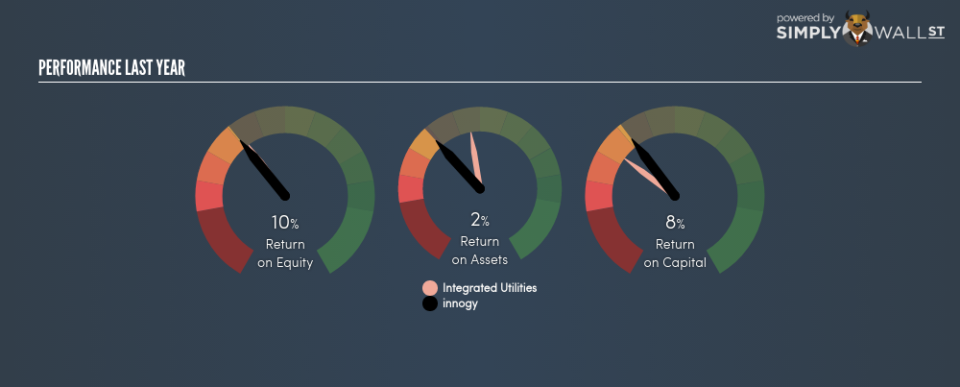
innogy SE (FRA:IGY) generated a below-average return on equity of 9.77% in the past 12 months, while its industry returned 10.32%. IGY’s results could indicate a relatively inefficient operation to its peers, and while this may be the case, it is important to understand what ROE is made up of and how it should be interpreted. Knowing these components could change your view on IGY’s performance. Metrics such as financial leverage can impact the level of ROE which in turn can affect the sustainability of IGY’s returns. Let me show you what I mean by this. See our latest analysis for innogy
Breaking down Return on Equity
Return on Equity (ROE) is a measure of innogy’s profit relative to its shareholders’ equity. It essentially shows how much the company can generate in earnings given the amount of equity it has raised. Generally speaking, a higher ROE is preferred; however, there are other factors we must also consider before making any conclusions.
Return on Equity = Net Profit ÷ Shareholders Equity
ROE is assessed against cost of equity, which is measured using the Capital Asset Pricing Model (CAPM) – but let’s not dive into the details of that today. For now, let’s just look at the cost of equity number for innogy, which is 8.39%. innogy’s ROE exceeds its cost by 1.38%, which is a big tick. Some of its peers with higher ROE may face a cost which exceeds returns, which is unsustainable and far less desirable than innogy’s case of positive discrepancy. ROE can be broken down into three different ratios: net profit margin, asset turnover, and financial leverage. This is called the Dupont Formula:
Dupont Formula
ROE = profit margin × asset turnover × financial leverage
ROE = (annual net profit ÷ sales) × (sales ÷ assets) × (assets ÷ shareholders’ equity)
ROE = annual net profit ÷ shareholders’ equity
The first component is profit margin, which measures how much of sales is retained after the company pays for all its expenses. The other component, asset turnover, illustrates how much revenue innogy can make from its asset base. And finally, financial leverage is simply how much of assets are funded by equity, which exhibits how sustainable the company’s capital structure is. Since financial leverage can artificially inflate ROE, we need to look at how much debt innogy currently has. Currently the debt-to-equity ratio stands at a high 153.25%, which means its below-average ROE is already being driven by significant debt levels.

Next Steps:
ROE is one of many ratios which meaningfully dissects financial statements, which illustrates the quality of a company. Even though innogy returned below the industry average, its ROE comes in excess of its cost of equity. However, with debt capital in excess of equity, ROE may already be inflated by the use of debt funding, raising questions over the possibility of further decline in the company’s returns. ROE is a helpful signal, but it is definitely not sufficient on its own to make an investment decision.
For innogy, I’ve compiled three fundamental aspects you should further examine:
Financial Health: Does it have a healthy balance sheet? Take a look at our free balance sheet analysis with six simple checks on key factors like leverage and risk.
Valuation: What is innogy worth today? Is the stock undervalued, even when its growth outlook is factored into its intrinsic value? The intrinsic value infographic in our free research report helps visualize whether innogy is currently mispriced by the market.
Other High-Growth Alternatives : Are there other high-growth stocks you could be holding instead of innogy? Explore our interactive list of stocks with large growth potential to get an idea of what else is out there you may be missing!
To help readers see pass the short term volatility of the financial market, we aim to bring you a long-term focused research analysis purely driven by fundamental data. Note that our analysis does not factor in the latest price sensitive company announcements.
The author is an independent contributor and at the time of publication had no position in the stocks mentioned.
