Should RSA Insurance Group plc (LON:RSA) Focus On Improving This Fundamental Metric?

One of the best investments we can make is in our own knowledge and skill set. With that in mind, this article will work through how we can use Return On Equity (ROE) to better understand a business. We'll use ROE to examine RSA Insurance Group plc (LON:RSA), by way of a worked example.
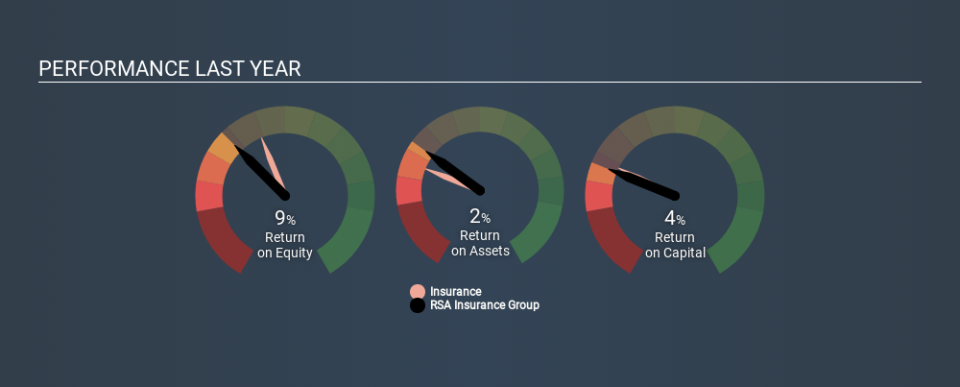
RSA Insurance Group has a ROE of 8.8%, based on the last twelve months. One way to conceptualize this, is that for each £1 of shareholders' equity it has, the company made £0.09 in profit.
View our latest analysis for RSA Insurance Group
How Do You Calculate Return On Equity?
The formula for ROE is:
Return on Equity = Net Profit (from continuing operations) ÷ Shareholders' Equity
Or for RSA Insurance Group:
8.8% = UK£383m ÷ UK£4.3b (Based on the trailing twelve months to December 2019.)
It's easy to understand the 'net profit' part of that equation, but 'shareholders' equity' requires further explanation. It is all earnings retained by the company, plus any capital paid in by shareholders. Shareholders' equity can be calculated by subtracting the total liabilities of the company from the total assets of the company.
What Does ROE Signify?
ROE looks at the amount a company earns relative to the money it has kept within the business. The 'return' is the profit over the last twelve months. That means that the higher the ROE, the more profitable the company is. So, all else equal, investors should like a high ROE. Clearly, then, one can use ROE to compare different companies.
Does RSA Insurance Group Have A Good ROE?
Arguably the easiest way to assess company's ROE is to compare it with the average in its industry. However, this method is only useful as a rough check, because companies do differ quite a bit within the same industry classification. As is clear from the image below, RSA Insurance Group has a lower ROE than the average (12%) in the Insurance industry.
That's not what we like to see. It is better when the ROE is above industry average, but a low one doesn't necessarily mean the business is overpriced. Still, shareholders might want to check if insiders have been selling.
How Does Debt Impact Return On Equity?
Virtually all companies need money to invest in the business, to grow profits. That cash can come from issuing shares, retained earnings, or debt. In the case of the first and second options, the ROE will reflect this use of cash, for growth. In the latter case, the debt required for growth will boost returns, but will not impact the shareholders' equity. That will make the ROE look better than if no debt was used.
RSA Insurance Group's Debt And Its 8.8% ROE
Although RSA Insurance Group does use debt, its debt to equity ratio of 0.21 is still low. The fact that it achieved a fairly good ROE with only modest debt suggests the business might be worth putting on your watchlist. Conservative use of debt to boost returns is usually a good move for shareholders, though it does leave the company more exposed to interest rate rises.
But It's Just One Metric
Return on equity is one way we can compare the business quality of different companies. A company that can achieve a high return on equity without debt could be considered a high quality business. If two companies have around the same level of debt to equity, and one has a higher ROE, I'd generally prefer the one with higher ROE.
Having said that, while ROE is a useful indicator of business quality, you'll have to look at a whole range of factors to determine the right price to buy a stock. It is important to consider other factors, such as future profit growth -- and how much investment is required going forward. So you might want to check this FREE visualization of analyst forecasts for the company.
Of course RSA Insurance Group may not be the best stock to buy. So you may wish to see this free collection of other companies that have high ROE and low debt.
If you spot an error that warrants correction, please contact the editor at editorial-team@simplywallst.com. This article by Simply Wall St is general in nature. It does not constitute a recommendation to buy or sell any stock, and does not take account of your objectives, or your financial situation. Simply Wall St has no position in the stocks mentioned.
We aim to bring you long-term focused research analysis driven by fundamental data. Note that our analysis may not factor in the latest price-sensitive company announcements or qualitative material. Thank you for reading.
