Ryerson Holding's (NYSE:RYI) three-year earnings growth trails the impressive shareholder returns
It might seem bad, but the worst that can happen when you buy a stock (without leverage) is that its share price goes to zero. But when you pick a company that is really flourishing, you can make more than 100%. For instance the Ryerson Holding Corporation (NYSE:RYI) share price is 257% higher than it was three years ago. How nice for those who held the stock! It's also good to see the share price up 38% over the last quarter.
Since it's been a strong week for Ryerson Holding shareholders, let's have a look at trend of the longer term fundamentals.
View our latest analysis for Ryerson Holding
To quote Buffett, 'Ships will sail around the world but the Flat Earth Society will flourish. There will continue to be wide discrepancies between price and value in the marketplace...' By comparing earnings per share (EPS) and share price changes over time, we can get a feel for how investor attitudes to a company have morphed over time.
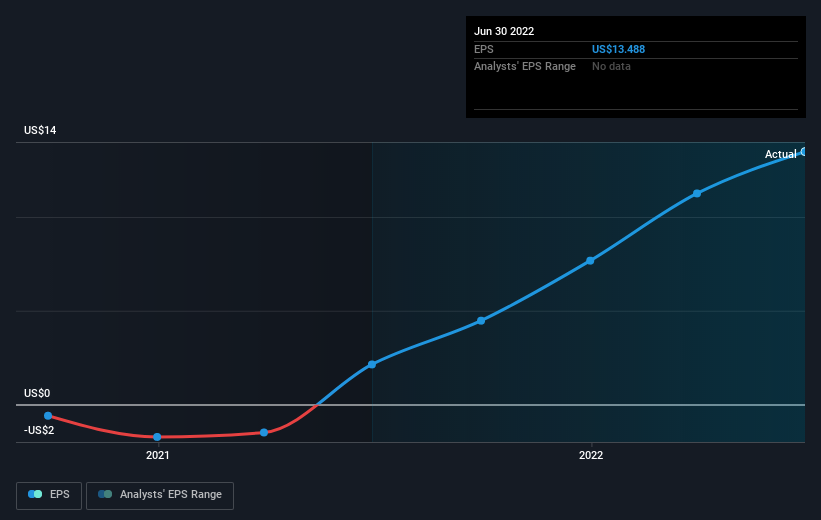
Ryerson Holding was able to grow its EPS at 62% per year over three years, sending the share price higher. We note that the 53% yearly (average) share price gain isn't too far from the EPS growth rate. Coincidence? Probably not. This suggests that sentiment and expectations have not changed drastically. Rather, the share price has approximately tracked EPS growth.
You can see below how EPS has changed over time (discover the exact values by clicking on the image).
It is of course excellent to see how Ryerson Holding has grown profits over the years, but the future is more important for shareholders. You can see how its balance sheet has strengthened (or weakened) over time in this free interactive graphic.
What About Dividends?
It is important to consider the total shareholder return, as well as the share price return, for any given stock. The TSR incorporates the value of any spin-offs or discounted capital raisings, along with any dividends, based on the assumption that the dividends are reinvested. Arguably, the TSR gives a more comprehensive picture of the return generated by a stock. We note that for Ryerson Holding the TSR over the last 3 years was 264%, which is better than the share price return mentioned above. And there's no prize for guessing that the dividend payments largely explain the divergence!
A Different Perspective
We're pleased to report that Ryerson Holding shareholders have received a total shareholder return of 35% over one year. Of course, that includes the dividend. That gain is better than the annual TSR over five years, which is 25%. Therefore it seems like sentiment around the company has been positive lately. Given the share price momentum remains strong, it might be worth taking a closer look at the stock, lest you miss an opportunity. While it is well worth considering the different impacts that market conditions can have on the share price, there are other factors that are even more important. Like risks, for instance. Every company has them, and we've spotted 4 warning signs for Ryerson Holding (of which 1 shouldn't be ignored!) you should know about.
If you are like me, then you will not want to miss this free list of growing companies that insiders are buying.
Please note, the market returns quoted in this article reflect the market weighted average returns of stocks that currently trade on US exchanges.
Have feedback on this article? Concerned about the content? Get in touch with us directly. Alternatively, email editorial-team (at) simplywallst.com.
This article by Simply Wall St is general in nature. We provide commentary based on historical data and analyst forecasts only using an unbiased methodology and our articles are not intended to be financial advice. It does not constitute a recommendation to buy or sell any stock, and does not take account of your objectives, or your financial situation. We aim to bring you long-term focused analysis driven by fundamental data. Note that our analysis may not factor in the latest price-sensitive company announcements or qualitative material. Simply Wall St has no position in any stocks mentioned.
Join A Paid User Research Session
You’ll receive a US$30 Amazon Gift card for 1 hour of your time while helping us build better investing tools for the individual investors like yourself. Sign up here
