Are SAF-Holland SA’s (FRA:SFQ) Interest Costs Too High?

Investors are always looking for growth in small-cap stocks like SAF-Holland SA (FRA:SFQ), with a market cap of €707.70m. However, an important fact which most ignore is: how financially healthy is the business? So, understanding the company’s financial health becomes crucial, since poor capital management may bring about bankruptcies, which occur at a higher rate for small-caps. I believe these basic checks tell most of the story you need to know. Though, this commentary is still very high-level, so I recommend you dig deeper yourself into SFQ here.
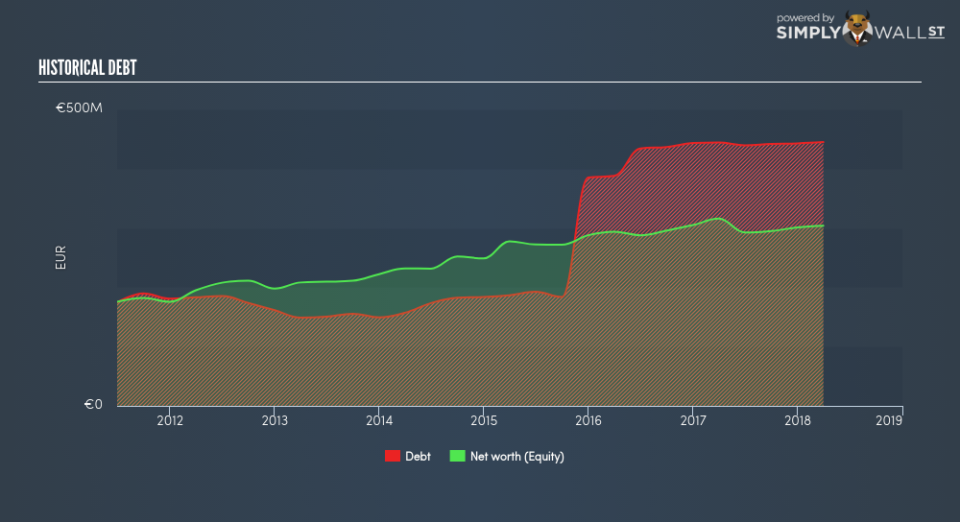
How much cash does SFQ generate through its operations?
SFQ’s debt level has been constant at around €442.66m over the previous year – this includes both the current and long-term debt. At this constant level of debt, SFQ currently has €337.16m remaining in cash and short-term investments for investing into the business. Additionally, SFQ has produced cash from operations of €56.75m over the same time period, resulting in an operating cash to total debt ratio of 12.82%, signalling that SFQ’s operating cash is not sufficient to cover its debt. This ratio can also be interpreted as a measure of efficiency as an alternative to return on assets. In SFQ’s case, it is able to generate 0.13x cash from its debt capital.
Does SFQ’s liquid assets cover its short-term commitments?
Looking at SFQ’s most recent €235.25m liabilities, the company has maintained a safe level of current assets to meet its obligations, with the current ratio last standing at 2.64x. For Auto Components companies, this ratio is within a sensible range since there is a bit of a cash buffer without leaving too much capital in a low-return environment.
Can SFQ service its debt comfortably?
SFQ is a highly-leveraged company with debt exceeding equity by over 100%. This is not uncommon for a small-cap company given that debt tends to be lower-cost and at times, more accessible. We can test if SFQ’s debt levels are sustainable by measuring interest payments against earnings of a company. Ideally, earnings before interest and tax (EBIT) should cover net interest by at least three times. For SFQ, the ratio of 5.92x suggests that interest is appropriately covered, which means that lenders may be inclined to lend more money to the company, as it is seen as safe in terms of payback.
Next Steps:
At its current level of cash flow coverage, SFQ has room for improvement to better cushion for events which may require debt repayment. Though, the company exhibits an ability to meet its near term obligations should an adverse event occur. Keep in mind I haven’t considered other factors such as how SFQ has been performing in the past. I recommend you continue to research SAF-Holland to get a better picture of the stock by looking at:
Future Outlook: What are well-informed industry analysts predicting for SFQ’s future growth? Take a look at our free research report of analyst consensus for SFQ’s outlook.
Valuation: What is SFQ worth today? Is the stock undervalued, even when its growth outlook is factored into its intrinsic value? The intrinsic value infographic in our free research report helps visualize whether SFQ is currently mispriced by the market.
Other High-Performing Stocks: Are there other stocks that provide better prospects with proven track records? Explore our free list of these great stocks here.
To help readers see pass the short term volatility of the financial market, we aim to bring you a long-term focused research analysis purely driven by fundamental data. Note that our analysis does not factor in the latest price sensitive company announcements.
The author is an independent contributor and at the time of publication had no position in the stocks mentioned.
