Is SB Financial Group, Inc. (NASDAQ:SBFG) A Smart Choice For Dividend Investors?

Want to participate in a short research study? Help shape the future of investing tools and you could win a $250 gift card!
Dividend paying stocks like SB Financial Group, Inc. (NASDAQ:SBFG) tend to be popular with investors, and for good reason - some research suggests a significant amount of all stock market returns come from reinvested dividends. If you are hoping to live on your dividends, it's important to be more stringent with your investments than the average punter. Regular readers know we like to apply the same approach to each dividend stock, and we hope you'll find our analysis useful.
A 2.2% yield is nothing to get excited about, but investors probably think the long payment history suggests SB Financial Group has some staying power. The company also bought back stock equivalent to around 1.0% of market capitalisation this year. Some simple analysis can offer a lot of insights when buying a company for its dividend, and we'll go through this below.
Explore this interactive chart for our latest analysis on SB Financial Group!
Payout ratios
Dividends are typically paid from company earnings. If a company pays more in dividends than it earned, then the dividend might become unsustainable - hardly an ideal situation. So we need to form a view on if a company's dividend is sustainable, relative to its net profit after tax. Looking at the data, we can see that 20% of SB Financial Group's profits were paid out as dividends in the last 12 months. With a low payout ratio, it looks like the dividend is comprehensively covered by earnings.
We update our data on SB Financial Group every 24 hours, so you can always get our latest analysis of its financial health, here.
Dividend Volatility
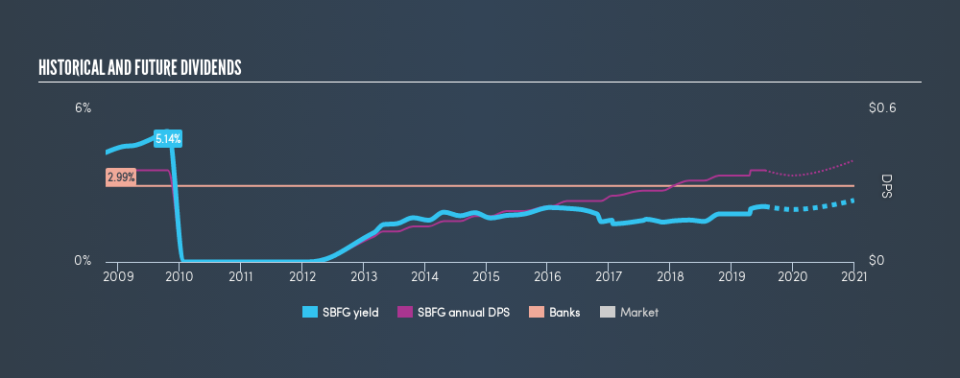
One of the major risks of relying on dividend income, is the potential for a company to struggle financially and cut its dividend. Not only is your income cut, but the value of your investment declines as well - nasty. SB Financial Group has been paying dividends for a long time, but for the purpose of this analysis, we only examine the past 10 years of payments. This dividend has been unstable, which we define as having fallen by at least 20% one or more times over this time. Its most recent annual dividend was US$0.36 per share, effectively flat on its first payment ten years ago.
We're glad to see the dividend has risen, but with a limited rate of growth and fluctuations in the payments, we don't think this is an attractive combination.
Dividend Growth Potential
With a relatively unstable dividend, it's even more important to see if earnings per share (EPS) are growing. Why take the risk of a dividend getting cut, unless there's a good chance of bigger dividends in future? Earnings have grown at around 8.7% a year for the past five years, which is better than seeing them shrink! A low payout ratio and strong historical earnings growth suggests SB Financial Group has been effectively reinvesting in its business. We think this generally bodes well for its dividend prospects.
Conclusion
Dividend investors should always want to know if a) a company's dividends are affordable, b) if there is a track record of consistent payments, and c) if the dividend is capable of growing. We're glad to see SB Financial Group has a low payout ratio, as this suggests earnings are being reinvested in the business. We were also glad to see it growing earnings, but it was concerning to see the dividend has been cut at least once in the past. SB Financial Group has a credible record on several fronts, but falls slightly short of our standards for a dividend stock.
You can also discover whether shareholders are aligned with insider interests by checking our visualisation of insider shareholdings and trades in SB Financial Group stock.
We have also put together a list of global stocks with a market capitalisation above $1bn and yielding more 3%.
We aim to bring you long-term focused research analysis driven by fundamental data. Note that our analysis may not factor in the latest price-sensitive company announcements or qualitative material.
If you spot an error that warrants correction, please contact the editor at editorial-team@simplywallst.com. This article by Simply Wall St is general in nature. It does not constitute a recommendation to buy or sell any stock, and does not take account of your objectives, or your financial situation. Simply Wall St has no position in the stocks mentioned. Thank you for reading.
