Can We See Significant Insider Ownership On The Natural Health Trends Corp. (NASDAQ:NHTC) Share Register?

Every investor in Natural Health Trends Corp. (NASDAQ:NHTC) should be aware of the most powerful shareholder groups. Large companies usually have institutions as shareholders, and we usually see insiders owning shares in smaller companies. I generally like to see some degree of insider ownership, even if only a little. As Nassim Nicholas Taleb said, ‘Don’t tell me what you think, tell me what you have in your portfolio.’
Natural Health Trends is a smaller company with a market capitalization of US$224m, so it may still be flying under the radar of many institutional investors. Taking a look at the our data on the ownership groups (below), it’s seems that institutional investors have bought into the company. Let’s take a closer look to see what the different types of shareholder can tell us about NHTC.
See our latest analysis for Natural Health Trends
Want to help shape the future of investing tools and platforms? Take the survey and be part of one of the most advanced studies of stock market investors to date.
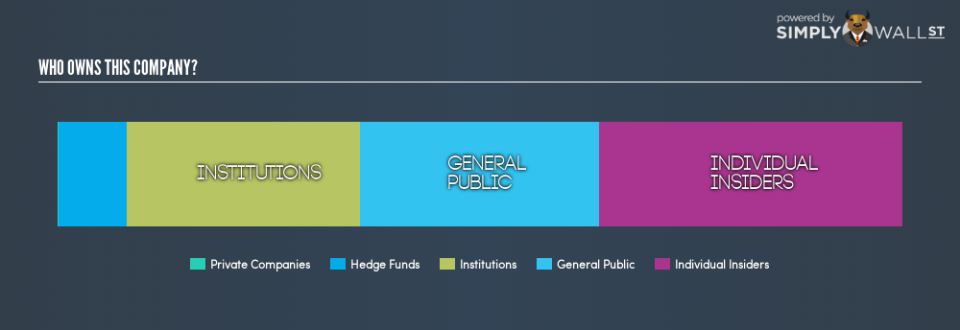
What Does The Institutional Ownership Tell Us About Natural Health Trends?
Institutions typically measure themselves against a benchmark when reporting to their own investors, so they often become more enthusiastic about a stock once it’s included in a major index. We would expect most companies to have some institutions on the register, especially if they are growing.
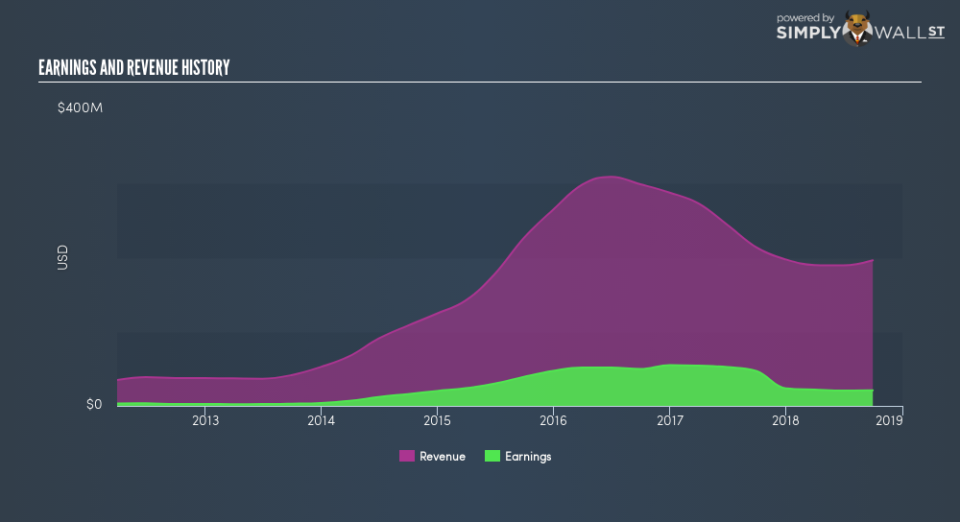
Natural Health Trends already has institutions on the share registry. Indeed, they own 28% of the company. This can indicate that the company has a certain degree of credibility in the investment community. However, it is best to be wary of relying on the supposed validation that comes with institutional investors. They too, get it wrong sometimes. It is not uncommon to see a big share price drop if two large institutional investors try to sell out of a stock at the same time. So it is worth checking the past earnings trajectory of Natural Health Trends, (below). Of course, keep in mind that there are other factors to consider, too.
It looks like hedge funds own 8.0% of Natural Health Trends shares. That’s interesting, because hedge funds can be quite active and activist. Many look for medium term catalysts that will drive the share price higher. We’re not picking up on any analyst coverage of the stock at the moment, so the company is unlikely to be widely held.
Insider Ownership Of Natural Health Trends
While the precise definition of an insider can be subjective, almost everyone considers board members to be insiders. Company management run the business, but the CEO will answer to the board, even if he or she is a member of it.
Most consider insider ownership a positive because it can indicate the board is well aligned with other shareholders. However, on some occasions too much power is concentrated within this group.
Our most recent data indicates that insiders own a reasonable proportion of Natural Health Trends Corp.. It has a market capitalization of just US$224m, and insiders have US$80m worth of shares in their own names. I would say this shows alignment with shareholders, but it is worth noting that the company is still quite small; some insiders may have founded the business. You can click here to see if those insiders have been buying or selling.
General Public Ownership
The general public, with a 28% stake in the company, will not easily be ignored. While this size of ownership may not be enough to sway a policy decision in their favour, they can still make a collective impact on company policies.
Next Steps:
I find it very interesting to look at who exactly owns a company. But to truly gain insight, we need to consider other information, too.
I like to dive deeper into how a company has performed in the past. You can find historic revenue and earnings in this detailed graph.
If you would prefer check out another company — one with potentially superior financials — then do not miss this free list of interesting companies, backed by strong financial data.
NB: Figures in this article are calculated using data from the last twelve months, which refer to the 12-month period ending on the last date of the month the financial statement is dated. This may not be consistent with full year annual report figures.
To help readers see past the short term volatility of the financial market, we aim to bring you a long-term focused research analysis purely driven by fundamental data. Note that our analysis does not factor in the latest price-sensitive company announcements.
The author is an independent contributor and at the time of publication had no position in the stocks mentioned. For errors that warrant correction please contact the editor at editorial-team@simplywallst.com.
