Can We See Significant Insider Ownership On The Zynerba Pharmaceuticals, Inc. (NASDAQ:ZYNE) Share Register?

Want to participate in a short research study? Help shape the future of investing tools and you could win a $250 gift card!
The big shareholder groups in Zynerba Pharmaceuticals, Inc. (NASDAQ:ZYNE) have power over the company. Insiders often own a large chunk of younger, smaller, companies while huge companies tend to have institutions as shareholders. I generally like to see some degree of insider ownership, even if only a little. As Nassim Nicholas Taleb said, 'Don’t tell me what you think, tell me what you have in your portfolio.'
With a market capitalization of US$258m, Zynerba Pharmaceuticals is a small cap stock, so it might not be well known by many institutional investors. Our analysis of the ownership of the company, below, shows that institutions are noticeable on the share registry. Let's take a closer look to see what the different types of shareholder can tell us about ZYNE.
View our latest analysis for Zynerba Pharmaceuticals
What Does The Institutional Ownership Tell Us About Zynerba Pharmaceuticals?
Institutions typically measure themselves against a benchmark when reporting to their own investors, so they often become more enthusiastic about a stock once it's included in a major index. We would expect most companies to have some institutions on the register, especially if they are growing.
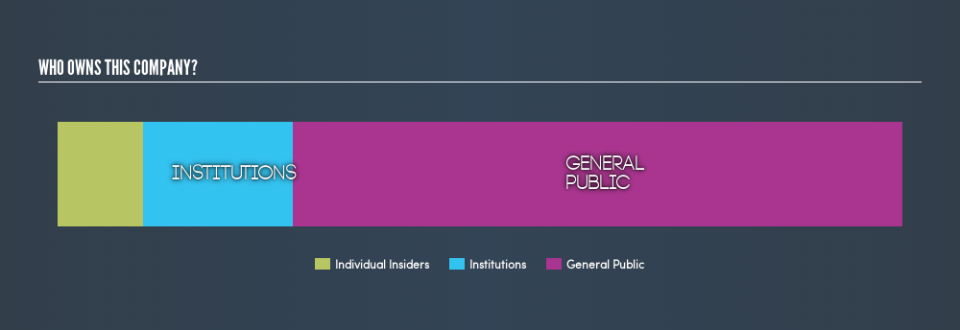
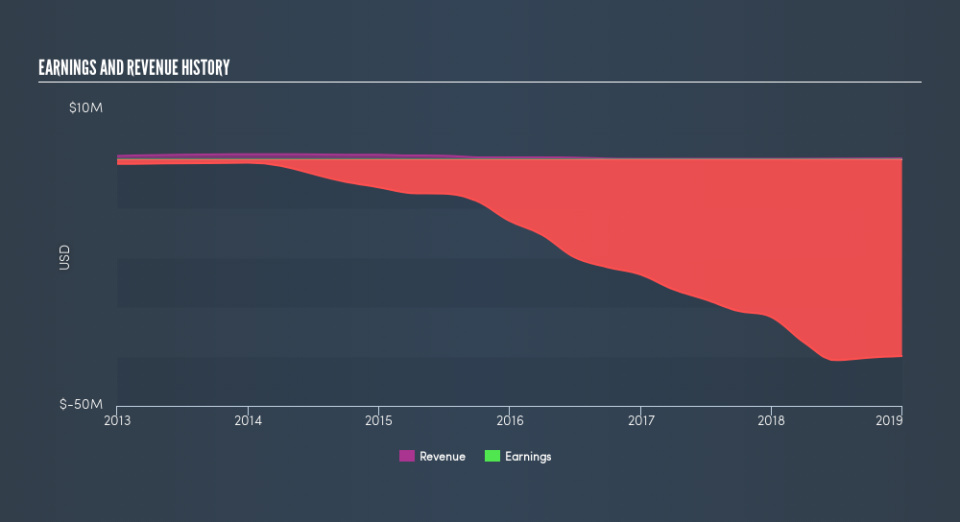
Zynerba Pharmaceuticals already has institutions on the share registry. Indeed, they own 18% of the company. This can indicate that the company has a certain degree of credibility in the investment community. However, it is best to be wary of relying on the supposed validation that comes with institutional investors. They too, get it wrong sometimes. When multiple institutions own a stock, there's always a risk that they are in a 'crowded trade'. When such a trade goes wrong, multiple parties may compete to sell stock fast. This risk is higher in a company without a history of growth. You can see Zynerba Pharmaceuticals's historic earnings and revenue, below, but keep in mind there's always more to the story.
Zynerba Pharmaceuticals is not owned by hedge funds. There are a reasonable number of analysts covering the stock, so it might be useful to find out their aggregate view on the future.
Insider Ownership Of Zynerba Pharmaceuticals
The definition of an insider can differ slightly between different countries, but members of the board of directors always count. The company management answer to the board; and the latter should represent the interests of shareholders. Notably, sometimes top-level managers are on the board, themselves.
Insider ownership is positive when it signals leadership are thinking like the true owners of the company. However, high insider ownership can also give immense power to a small group within the company. This can be negative in some circumstances.
Our information suggests that insiders maintain a significant holding in Zynerba Pharmaceuticals, Inc.. Insiders own US$26m worth of shares in the US$258m company. I would say this shows alignment with shareholders, but it is worth noting that the company is still quite small; some insiders may have founded the business. You can click here to see if those insiders have been buying or selling.
General Public Ownership
The general public, who are mostly retail investors, collectively hold 72% of Zynerba Pharmaceuticals shares. With this size of ownership, retail investors can collectively play a role in decisions that affect shareholder returns, such as dividend policies and the appointment of directors. They can also exercise the power to decline an acquisition or merger that may not improve profitability.
Next Steps:
I find it very interesting to look at who exactly owns a company. But to truly gain insight, we need to consider other information, too.
I like to dive deeper into how a company has performed in the past. You can find historic revenue and earnings in this detailed graph.
If you would prefer discover what analysts are predicting in terms of future growth, do not miss this free report on analyst forecasts.
NB: Figures in this article are calculated using data from the last twelve months, which refer to the 12-month period ending on the last date of the month the financial statement is dated. This may not be consistent with full year annual report figures.
We aim to bring you long-term focused research analysis driven by fundamental data. Note that our analysis may not factor in the latest price-sensitive company announcements or qualitative material.
If you spot an error that warrants correction, please contact the editor at editorial-team@simplywallst.com. This article by Simply Wall St is general in nature. It does not constitute a recommendation to buy or sell any stock, and does not take account of your objectives, or your financial situation. Simply Wall St has no position in the stocks mentioned. Thank you for reading.
