Seeing Beyond VWO And Its New FTSE Index
When I heard about the $57 billion Vanguard MSCI Emerging Markets ETF (VWO) dropping the MSCI Emerging Markets Index for the FTSE Emerging Index, my first thoughts were favorable.
That’s mostly because I’ve questioned for some time South Korea’s “emerging” status in MSCI’s index.
That said, the coming changes aren’t enough to alter my tune about VWO or, for that matter, the iShares MSCI Emerging Markets Index Fund (EEM).
I’ve always thought comparing VWO and EEM was like comparing two identical apples with simply different stem lengths. They track the same index and, for the retail investor, VWO probably made more sense simply because it’s so much cheaper than EEM.
I think I’ve made it clear in recent blogs that I’m not exactly a fan of either VWO or EEM. While EEM was certainly the fund to own over the past decade—VWO didn’t launch until 2005—I think there are now better emerging markets ETF options with more potential for the next decade.
Still, VWO and EEM are the third- and fourth-largest ETFs in the world, and Vanguard’s switch to FTSE comes with some serious material differences that should be discussed.
There’s a lot to cover here, so I’m going to point out the main differences most relevant to the retail investor that will separate the new VWO from EEM.
Country Exposure
FTSE’s “developed” classification of South Korea is by far the biggest difference here. Not only did FTSE upgrade South Korea to “developed” status three years ago, S'P long ago upgraded South Korea to classify it as a developed market as well.
MSCI still classifies South Korea as “emerging,” which is why the country has about a 15 percent weighting in EEM and the current VWO. But once VWO switches over to the new FTSE index, the 15 percent weighting will be reallocated to the remaining countries in the index. (Thankfully, that transition will take place gradually.)
Looking ahead, it’s worth noting that MSCI currently has South Korea and Taiwan on its watch list for possible upgrades to “developed” status. Should that happen, which seems inevitable, both of those countries would eventually leave EEM.
Meanwhile, MSCI has Greece on a watch list to be downgraded to emerging, meaning EEM investors might see some Greek companies in their fund in the coming years. Qatar and UAE are on watch to be upgraded from frontier to emerging, so those two gulf states might appear in EEM as well.
On the FTSE side, like MSCI, Taiwan is on watch to be upgraded to developed-country status and Greece is also on watch to be downgraded to emerging.
But that’s where the similarities in their watch lists end.
FTSE has Poland on watch for upgrade to a developed market and Kuwait to be upgraded to emerging, meaning investors who hold on to VWO through the transition might see Polish companies taken out and Kuwaiti companies added.
Company Exposure
The exclusion of South Korea would inevitably mean investors in the new VWO would lose exposure to Korean mega-caps like Samsung, Hyundai, Posco and Kia.
But beyond South Korean firms, exposure to certain Chinese companies classified as P-chips might also be lost. P-chips are nonstate-owned Chinese companies incorporated outside of the mainland, most often in certain foreign jurisdictions (Cayman Islands) and traded in Hong Kong.
While MSCI includes P-chips in its indexes, FTSE currently classifies P-chips as Hong Kong companies, meaning they’re excluded from the FTSE Emerging Index.
VWO may lose exposure to some significant P-chips like Tencent Holdings, Want Want China and Belle International.
It’s worth noting that FTSE recently announced a reclassification of P-chips to China, so beginning in March 2013, P-chips will be reviewed for possible inclusion into the FTSE Emerging Index.
Cost Wars And Schwab’s SCHE
Interestingly, the $515 million Schwab Emerging Markets Equity ETF (SCHE), which also tracks the same FTSE index that VWO will track, made headlines last month when Schwab cut the expense ratio on the fund by 25 percent to 0.15 percent, undercutting VWO by 5 basis points.
The timing was quite interesting. VWO has been taking significant market share away from EEM for years, mostly due to its much lower expense ratio.
Now, only two weeks after SCHE’s fee-cut announcement, it looks like VWO is looking to slash again, as much of this index change was attributed to lowering costs.
My guess is that VWO will be cutting its expense ratio again—probably after the transition to the FTSE index is complete. I'd guess that VWO's new price might match or even undercut SCHE’s 0.15 percent.
Final Takeaway
To put all this into context, my guess is that to the average investor, these changes will mean very little, notwithstanding some big differences in country exposure.
When all is said and done, I expect to see VWO and EEM still being the No. 3 and No. 4 ETFs by assets for a while.
Still, to me, the real question is, Why invest in VWO or EEM?
Even excluding the South Korea factor, both indexes are heavily weighted in China, Brazil, Taiwan and South Africa. As these countries rapidly developed over the past decade, the funds’ correlations in returns to the broad equity markets have also spiked.
Smaller Is Better
I think it’s starting to make more sense to look at smaller emerging markets and even some frontier markets poised for higher growth in the next decade.
For example, ETFs such as the new EGShares Beyond BRICs ETF (BBRC) as well as country-specific ETFs focused on countries like Turkey, Poland, Indonesia, Thailand and the Philippines look promising.
If you’re looking at the frontier space and willing to take on the extra risk, the iShares MSCI Frontier 100 Index Fund (FM) also looks promising.
Or, if you want to stay with the BRICs, the dividend-weighted WisdomTree Emerging Markets Equity Income Fund (DEM) has also done well compared with EEM and VWO.
More broadly, how much do the MSCI and FTSE emerging markets indexes really differ when it comes to returns? Over the past three years—a good time period to look at because FTSE upgraded South Korea to “emerging” in 2009—they barely look different.
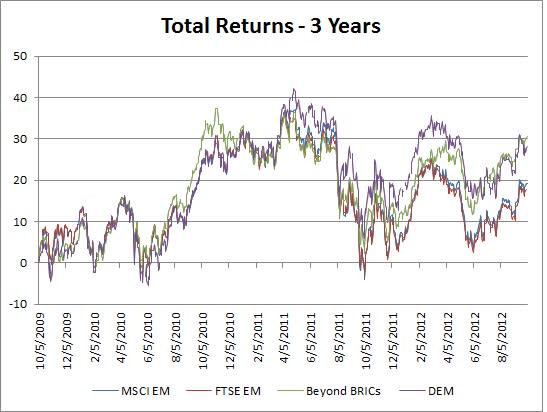
Source:Bloomberg
Yet look at how BBRC’s underlying index, which excludes the BRICs, Korea and Taiwan and focuses on smaller emerging markets instead, performed in comparison.
DEM, which carries an indicated yield of 5.8 percent, also performed well, beating both EEM and VWO. But more importantly, if volatility continues going forward, these large dividends help.
My point is that the Korea factor plays a small part in the total returns of VWO and EEM. So the question is not whether VWO will become better than EEM or not; it’s more about, Why buy either of them?
It just might be time to invest in the best emerging markets opportunities of the next decade, not of the past decade.
At the time this article was written, the author held a long position in FM. Contact Dennis Hudachek at dhudachek@indexuniverse.com.
Permalink | ' Copyright 2012 IndexUniverse LLC. All rights reserved
More From IndexUniverse.com
