Can Seplat Petroleum Development Company Plc’s (LON:SEPL) ROE Continue To Surpass The Industry Average?

I am writing today to help inform people who are new to the stock market and want to learn about Return on Equity using a real-life example.
Seplat Petroleum Development Company Plc (LON:SEPL) outperformed the Oil and Gas Exploration and Production industry on the basis of its ROE – producing a higher 22.4% relative to the peer average of 9.0% over the past 12 months. Superficially, this looks great since we know that SEPL has generated big profits with little equity capital; however, ROE doesn’t tell us how much SEPL has borrowed in debt. Today, we’ll take a closer look at some factors like financial leverage to see how sustainable SEPL’s ROE is.
See our latest analysis for Seplat Petroleum Development
Breaking down Return on Equity
Return on Equity (ROE) weighs Seplat Petroleum Development’s profit against the level of its shareholders’ equity. An ROE of 22.4% implies £0.22 returned on every £1 invested. While a higher ROE is preferred in most cases, there are several other factors we should consider before drawing any conclusions.
Return on Equity = Net Profit ÷ Shareholders Equity
ROE is measured against cost of equity in order to determine the efficiency of Seplat Petroleum Development’s equity capital deployed. Its cost of equity is 8.7%. Given a positive discrepancy of 13.8% between return and cost, this indicates that Seplat Petroleum Development pays less for its capital than what it generates in return, which is a sign of capital efficiency. ROE can be dissected into three distinct ratios: net profit margin, asset turnover, and financial leverage. This is called the Dupont Formula:
Dupont Formula
ROE = profit margin × asset turnover × financial leverage
ROE = (annual net profit ÷ sales) × (sales ÷ assets) × (assets ÷ shareholders’ equity)
ROE = annual net profit ÷ shareholders’ equity

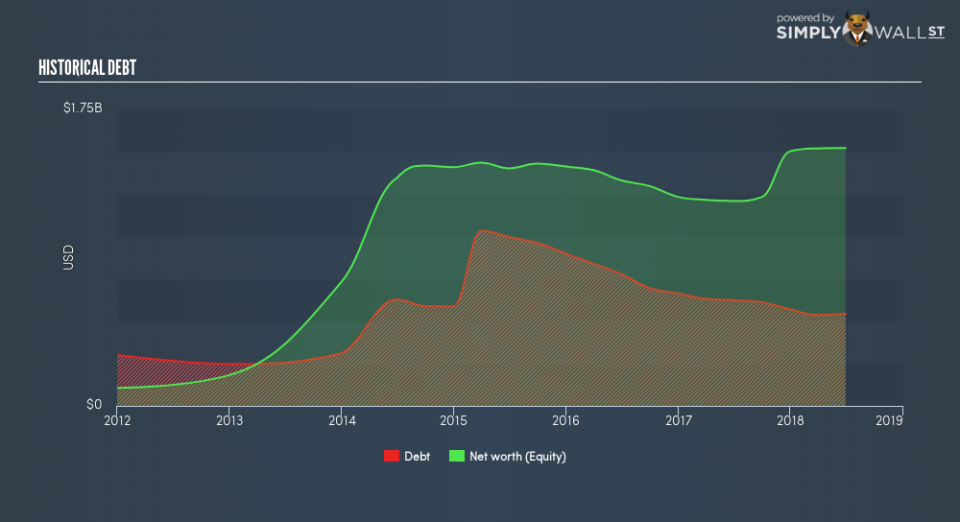
The first component is profit margin, which measures how much of sales is retained after the company pays for all its expenses. Asset turnover shows how much revenue Seplat Petroleum Development can generate with its current asset base. Finally, financial leverage will be our main focus today. It shows how much of assets are funded by equity and can show how sustainable the company’s capital structure is. Since ROE can be inflated by excessive debt, we need to examine Seplat Petroleum Development’s debt-to-equity level. At 35.8%, Seplat Petroleum Development’s debt-to-equity ratio appears low and indicates the above-average ROE is generated from its capacity to increase profit without a large debt burden.
Next Steps:
ROE is one of many ratios which meaningfully dissects financial statements, which illustrates the quality of a company. Seplat Petroleum Development’s ROE is impressive relative to the industry average and also covers its cost of equity. Its high ROE is not likely to be driven by high debt. Therefore, investors may have more confidence in the sustainability of this level of returns going forward. ROE is a helpful signal, but it is definitely not sufficient on its own to make an investment decision.
For Seplat Petroleum Development, there are three essential aspects you should look at:
Financial Health: Does it have a healthy balance sheet? Take a look at our free balance sheet analysis with six simple checks on key factors like leverage and risk.
Valuation: What is Seplat Petroleum Development worth today? Is the stock undervalued, even when its growth outlook is factored into its intrinsic value? The intrinsic value infographic in our free research report helps visualize whether Seplat Petroleum Development is currently mispriced by the market.
Other High-Growth Alternatives : Are there other high-growth stocks you could be holding instead of Seplat Petroleum Development? Explore our interactive list of stocks with large growth potential to get an idea of what else is out there you may be missing!
To help readers see past the short term volatility of the financial market, we aim to bring you a long-term focused research analysis purely driven by fundamental data. Note that our analysis does not factor in the latest price-sensitive company announcements.
The author is an independent contributor and at the time of publication had no position in the stocks mentioned. For errors that warrant correction please contact the editor at editorial-team@simplywallst.com.
