What Is SG Fleet Group's (ASX:SGF) P/E Ratio After Its Share Price Rocketed?

Those holding SG Fleet Group (ASX:SGF) shares must be pleased that the share price has rebounded 39% in the last thirty days. But unfortunately, the stock is still down by 27% over a quarter. But shareholders may not all be feeling jubilant, since the share price is still down 46% in the last year.
Assuming no other changes, a sharply higher share price makes a stock less attractive to potential buyers. In the long term, share prices tend to follow earnings per share, but in the short term prices bounce around in response to short term factors (which are not always obvious). The implication here is that deep value investors might steer clear when expectations of a company are too high. One way to gauge market expectations of a stock is to look at its Price to Earnings Ratio (PE Ratio). A high P/E ratio means that investors have a high expectation about future growth, while a low P/E ratio means they have low expectations about future growth.
See our latest analysis for SG Fleet Group
Does SG Fleet Group Have A Relatively High Or Low P/E For Its Industry?
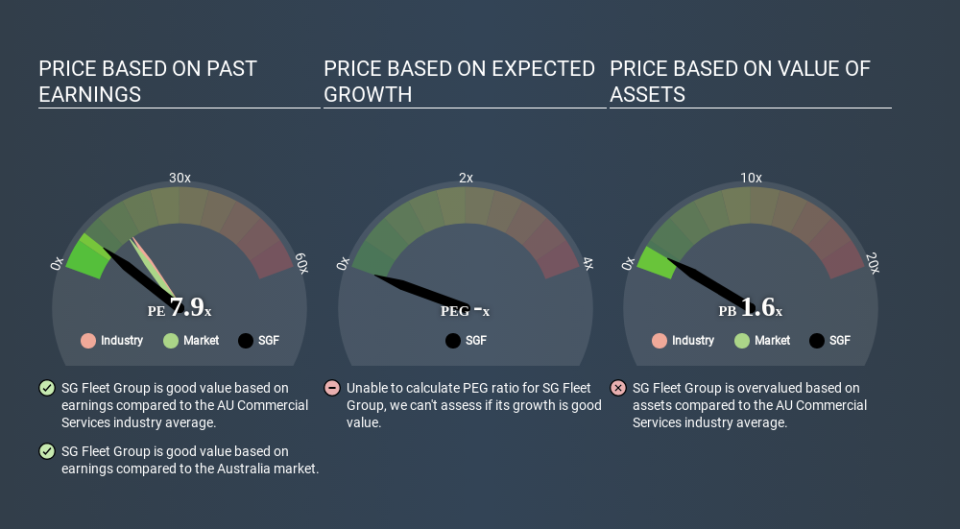
SG Fleet Group's P/E of 7.87 indicates relatively low sentiment towards the stock. We can see in the image below that the average P/E (15.7) for companies in the commercial services industry is higher than SG Fleet Group's P/E.
Its relatively low P/E ratio indicates that SG Fleet Group shareholders think it will struggle to do as well as other companies in its industry classification. While current expectations are low, the stock could be undervalued if the situation is better than the market assumes. It is arguably worth checking if insiders are buying shares, because that might imply they believe the stock is undervalued.
How Growth Rates Impact P/E Ratios
Companies that shrink earnings per share quickly will rapidly decrease the 'E' in the equation. Therefore, even if you pay a low multiple of earnings now, that multiple will become higher in the future. A higher P/E should indicate the stock is expensive relative to others -- and that may encourage shareholders to sell.
SG Fleet Group shrunk earnings per share by 16% over the last year.
A Limitation: P/E Ratios Ignore Debt and Cash In The Bank
It's important to note that the P/E ratio considers the market capitalization, not the enterprise value. In other words, it does not consider any debt or cash that the company may have on the balance sheet. Hypothetically, a company could reduce its future P/E ratio by spending its cash (or taking on debt) to achieve higher earnings.
Spending on growth might be good or bad a few years later, but the point is that the P/E ratio does not account for the option (or lack thereof).
SG Fleet Group's Balance Sheet
SG Fleet Group's net debt is 18% of its market cap. It would probably deserve a higher P/E ratio if it was net cash, since it would have more options for growth.
The Bottom Line On SG Fleet Group's P/E Ratio
SG Fleet Group's P/E is 7.9 which is below average (14.7) in the AU market. With only modest debt, it's likely the lack of EPS growth at least partially explains the pessimism implied by the P/E ratio. What we know for sure is that investors are becoming less uncomfortable about SG Fleet Group's prospects, since they have pushed its P/E ratio from 5.7 to 7.9 over the last month. For those who like to invest in turnarounds, that might mean it's time to put the stock on a watchlist, or research it. But others might consider the opportunity to have passed.
Investors should be looking to buy stocks that the market is wrong about. If the reality for a company is not as bad as the P/E ratio indicates, then the share price should increase as the market realizes this. So this free visualization of the analyst consensus on future earnings could help you make the right decision about whether to buy, sell, or hold.
Of course, you might find a fantastic investment by looking at a few good candidates. So take a peek at this free list of companies with modest (or no) debt, trading on a P/E below 20.
Love or hate this article? Concerned about the content? Get in touch with us directly. Alternatively, email editorial-team@simplywallst.com.
This article by Simply Wall St is general in nature. It does not constitute a recommendation to buy or sell any stock, and does not take account of your objectives, or your financial situation. We aim to bring you long-term focused analysis driven by fundamental data. Note that our analysis may not factor in the latest price-sensitive company announcements or qualitative material. Simply Wall St has no position in any stocks mentioned. Thank you for reading.
