Shareholders Should Look Hard At Cars.com Inc.’s (NYSE:CARS) 4.1% Return On Capital

Today we’ll look at Cars.com Inc. (NYSE:CARS) and reflect on its potential as an investment. Specifically, we’ll consider its Return On Capital Employed (ROCE), since that will give us an insight into how efficiently the business can generate profits from the capital it requires.
First, we’ll go over how we calculate ROCE. Next, we’ll compare it to others in its industry. And finally, we’ll look at how its current liabilities are impacting its ROCE.
Understanding Return On Capital Employed (ROCE)
ROCE measures the ‘return’ (pre-tax profit) a company generates from capital employed in its business. Generally speaking a higher ROCE is better. In brief, it is a useful tool, but it is not without drawbacks. Renowned investment researcher Michael Mauboussin has suggested that a high ROCE can indicate that ‘one dollar invested in the company generates value of more than one dollar’.
How Do You Calculate Return On Capital Employed?
The formula for calculating the return on capital employed is:
Return on Capital Employed = Earnings Before Interest and Tax (EBIT) ÷ (Total Assets – Current Liabilities)
Or for Cars.com:
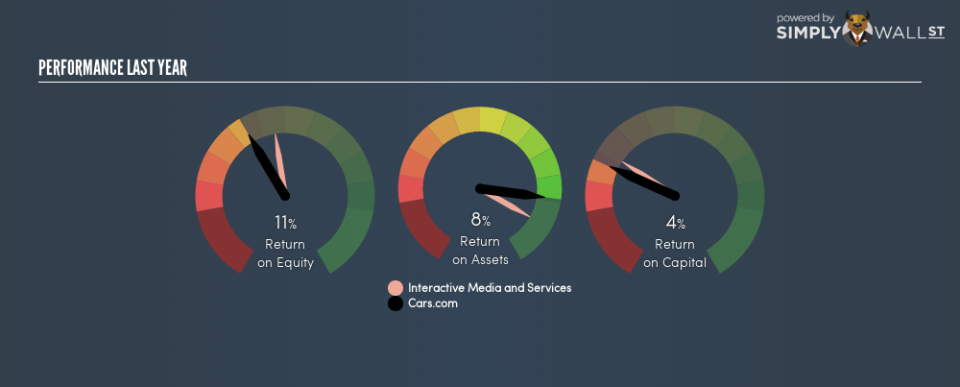
0.041 = US$136m ÷ (US$2.6b – US$114m) (Based on the trailing twelve months to September 2018.)
So, Cars.com has an ROCE of 4.1%.
Check out our latest analysis for Cars.com
Want to help shape the future of investing tools and platforms? Take the survey and be part of one of the most advanced studies of stock market investors to date.
Is Cars.com’s ROCE Good?
When making comparisons between similar businesses, investors may find ROCE useful. Using our data, Cars.com’s ROCE appears to be significantly below the 10% average in the Interactive Media and Services industry. This performance is not ideal, as it suggests the company may not be deploying its capital as effectively as some competitors. Putting aside Cars.com’s performance relative to its industry, its ROCE in absolute terms is poor – considering the risk of owning stocks compared to government bonds. Readers may wish to look for more rewarding investments.
When considering ROCE, bear in mind that it reflects the past and does not necessarily predict the future. Companies in cyclical industries can be difficult to understand using ROCE, as returns typically look high during boom times, and low during busts. This is because ROCE only looks at one year, instead of considering returns across a whole cycle. What happens in the future is pretty important for investors, so we have prepared a free report on analyst forecasts for Cars.com.
Cars.com’s Current Liabilities And Their Impact On Its ROCE
Current liabilities include invoices, such as supplier payments, short-term debt, or a tax bill, that need to be paid within 12 months. Due to the way ROCE is calculated, a high level of current liabilities makes a company look as though it has less capital employed, and thus can (sometimes unfairly) boost the ROCE. To check the impact of this, we calculate if a company has high current liabilities relative to its total assets.
Cars.com has total liabilities of US$114m and total assets of US$2.6b. As a result, its current liabilities are equal to approximately 4.4% of its total assets. Cars.com has very few current liabilities, which have a minimal effect on its already low ROCE.
What We Can Learn From Cars.com’s ROCE
Nevertheless, there are potentially more attractive companies to invest in. You might be able to find a better buy than Cars.com. If you want a selection of possible winners, check out this free list of interesting companies that trade on a P/E below 20 (but have proven they can grow earnings).
I will like Cars.com better if I see some big insider buys. While we wait, check out this free list of growing companies with considerable, recent, insider buying.
To help readers see past the short term volatility of the financial market, we aim to bring you a long-term focused research analysis purely driven by fundamental data. Note that our analysis does not factor in the latest price-sensitive company announcements.
The author is an independent contributor and at the time of publication had no position in the stocks mentioned. For errors that warrant correction please contact the editor at editorial-team@simplywallst.com.
