Shareholders Are Loving Stella-Jones Inc.'s (TSE:SJ) 1.2% Yield

Want to participate in a short research study? Help shape the future of investing tools and you could win a $250 gift card!
Could Stella-Jones Inc. (TSE:SJ) be an attractive dividend share to own for the long haul? Investors are often drawn to strong companies with the idea of reinvesting the dividends. Yet sometimes, investors buy a stock for its dividend and lose money because the share price falls by more than they earned in dividend payments.
While Stella-Jones's 1.2% dividend yield is not the highest, we think its lengthy payment history is quite interesting. Before you buy any stock for its dividend however, you should always remember Warren Buffett's two rules: 1) Don't lose money, and 2) Remember rule #1. We'll run through some checks below to help with this.
Explore this interactive chart for our latest analysis on Stella-Jones!
Payout ratios
Dividends are typically paid from company earnings. If a company pays more in dividends than it earned, then the dividend might become unsustainable - hardly an ideal situation. As a result, we should always investigate whether a company can afford its dividend, measured as a percentage of a company's net income after tax. Looking at the data, we can see that 24% of Stella-Jones's profits were paid out as dividends in the last 12 months. Given the low payout ratio, it is hard to envision the dividend coming under threat, barring a catastrophe.
We also measure dividends paid against a company's levered free cash flow, to see if enough cash was generated to cover the dividend. The company paid out 52% of its free cash flow, which is not bad per se, but does start to limit the amount of cash Stella-Jones has available to meet other needs. It's positive to see that Stella-Jones's dividend is covered by both profits and cash flow, since this is generally a sign that the dividend is sustainable, and a lower payout ratio usually suggests a greater margin of safety before the dividend gets cut.
Is Stella-Jones's Balance Sheet Risky?
As Stella-Jones has a meaningful amount of debt, we need to check its balance sheet to see if the company might have debt risks. A rough way to check this is with these two simple ratios: a) net debt divided by EBITDA (earnings before interest, tax, depreciation and amortisation), and b) net interest cover. Net debt to EBITDA is a measure of a company's total debt. Net interest cover measures the ability to meet interest payments on debt. Essentially we check that a) a company does not have too much debt, and b) that it can afford to pay the interest. With net debt of 2.32 times its EBITDA, Stella-Jones's debt burden is within a normal range for most listed companies.
We calculated its interest cover by measuring its earnings before interest and tax (EBIT), and dividing this by the company's net interest expense. Net interest cover of 10.65 times its interest expense appears reasonable for Stella-Jones, although we're conscious that even high interest cover doesn't make a company bulletproof.
We update our data on Stella-Jones every 24 hours, so you can always get our latest analysis of its financial health, here.
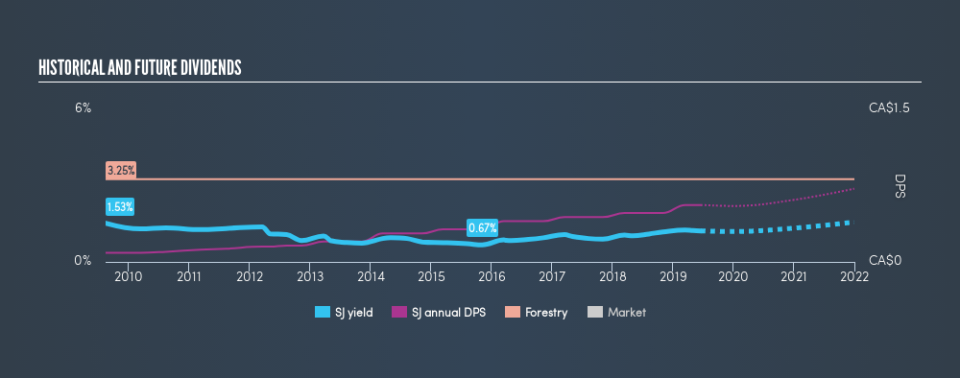
Dividend Volatility
Before buying a stock for its income, we want to see if the dividends have been stable in the past, and if the company has a track record of maintaining its dividend. Stella-Jones has been paying dividends for a long time, but for the purpose of this analysis, we only examine the past 10 years of payments. The dividend has been stable over the past 10 years, which is great. We think this could suggest some resilience to the business and its dividends. During the past ten-year period, the first annual payment was CA$0.09 in 2009, compared to CA$0.56 last year. Dividends per share have grown at approximately 20% per year over this time.
It's rare to find a company that has grown its dividends rapidly over ten years and not had any notable cuts, but Stella-Jones has done it, which we really like.
Dividend Growth Potential
While dividend payments have been relatively reliable, it would also be nice if earnings per share (EPS) were growing, as this is essential to maintaining the dividend's purchasing power over the long term. Earnings have grown at around 9.0% a year for the past five years, which is better than seeing them shrink! With a decent amount of growth and a low payout ratio, we think this bodes well for Stella-Jones's prospects of growing its dividend payments in the future.
Conclusion
To summarise, shareholders should always check that Stella-Jones's dividends are affordable, that its dividend payments are relatively stable, and that it has decent prospects for growing its earnings and dividend. Above all, we're glad to see that Stella-Jones pays out a low fraction of its earnings and, while it paid a higher percentage of cashflow, this also was within a normal range. That said, we were glad to see it growing earnings and paying a fairly consistent dividend. Stella-Jones performs highly under this analysis, although it falls slightly short of our exacting standards. At the right valuation, it could be a solid dividend prospect.
Earnings growth generally bodes well for the future value of company dividend payments. See if the 7 Stella-Jones analysts we track are forecasting continued growth with our free report on analyst estimates for the company.
If you are a dividend investor, you might also want to look at our curated list of dividend stocks yielding above 3%.
We aim to bring you long-term focused research analysis driven by fundamental data. Note that our analysis may not factor in the latest price-sensitive company announcements or qualitative material.
If you spot an error that warrants correction, please contact the editor at editorial-team@simplywallst.com. This article by Simply Wall St is general in nature. It does not constitute a recommendation to buy or sell any stock, and does not take account of your objectives, or your financial situation. Simply Wall St has no position in the stocks mentioned. Thank you for reading.
