Is Shawcor Ltd.’s (TSE:SCL) High P/E Ratio A Problem For Investors?

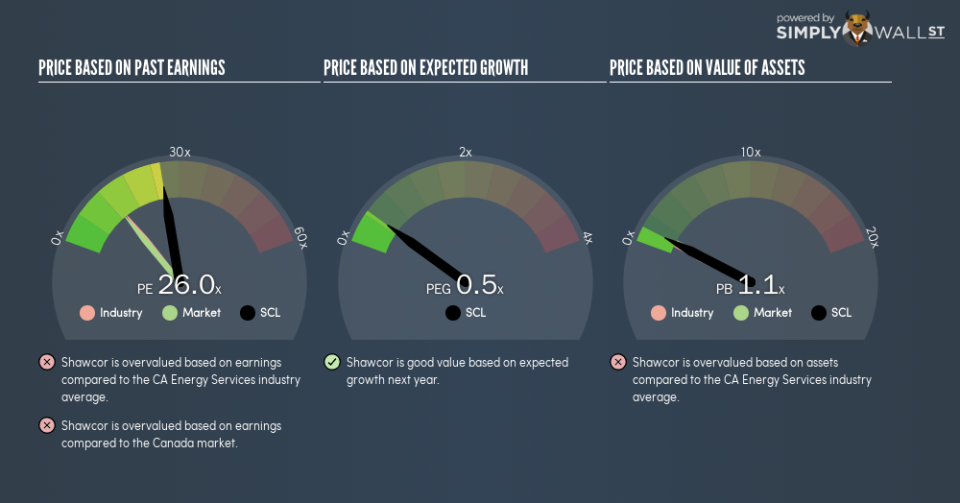
This article is for investors who would like to improve their understanding of price to earnings ratios (P/E ratios). We’ll look at Shawcor Ltd.’s (TSE:SCL) P/E ratio and reflect on what it tells us about the company’s share price. Based on the last twelve months, Shawcor’s P/E ratio is 25.97. In other words, at today’s prices, investors are paying CA$25.97 for every CA$1 in prior year profit.
View our latest analysis for Shawcor
How Do You Calculate A P/E Ratio?
The formula for price to earnings is:
Price to Earnings Ratio = Price per Share ÷ Earnings per Share (EPS)
Or for Shawcor:
P/E of 25.97 = CA$15.58 ÷ CA$0.60 (Based on the year to September 2018.)
Is A High Price-to-Earnings Ratio Good?
A higher P/E ratio means that buyers have to pay a higher price for each CA$1 the company has earned over the last year. That isn’t necessarily good or bad, but a high P/E implies relatively high expectations of what a company can achieve in the future.
How Growth Rates Impact P/E Ratios
Probably the most important factor in determining what P/E a company trades on is the earnings growth. That’s because companies that grow earnings per share quickly will rapidly increase the ‘E’ in the equation. That means unless the share price increases, the P/E will reduce in a few years. A lower P/E should indicate the stock is cheap relative to others — and that may attract buyers.
Shawcor shrunk earnings per share by 47% over the last year. But over the longer term (3 years), earnings per share have increased by 7.7%. And over the longer term (5 years) earnings per share have decreased 45% annually. This could justify a pessimistic P/E.
How Does Shawcor’s P/E Ratio Compare To Its Peers?
The P/E ratio indicates whether the market has higher or lower expectations of a company. As you can see below, Shawcor has a higher P/E than the average company (13.6) in the energy services industry.
Its relatively high P/E ratio indicates that Shawcor shareholders think it will perform better than other companies in its industry classification. Shareholders are clearly optimistic, but the future is always uncertain. So investors should always consider the P/E ratio alongside other factors, such as whether company directors have been buying shares.
A Limitation: P/E Ratios Ignore Debt and Cash In The Bank
It’s important to note that the P/E ratio considers the market capitalization, not the enterprise value. That means it doesn’t take debt or cash into account. In theory, a company can lower its future P/E ratio by using cash or debt to invest in growth.
Such spending might be good or bad, overall, but the key point here is that you need to look at debt to understand the P/E ratio in context.
How Does Shawcor’s Debt Impact Its P/E Ratio?
Shawcor has net debt worth just 6.6% of its market capitalization. The market might award it a higher P/E ratio if it had net cash, but its unlikely this low level of net borrowing is having a big impact on the P/E multiple.
The Bottom Line On Shawcor’s P/E Ratio
Shawcor has a P/E of 26. That’s higher than the average in the CA market, which is 13. With a bit of debt, but a lack of recent growth, it’s safe to say the market is expecting improved profit performance from the company, in the next few years.
When the market is wrong about a stock, it gives savvy investors an opportunity. As value investor Benjamin Graham famously said, ‘In the short run, the market is a voting machine but in the long run, it is a weighing machine.’ So this free report on the analyst consensus forecasts could help you make a master move on this stock.
You might be able to find a better buy than Shawcor. If you want a selection of possible winners, check out this free list of interesting companies that trade on a P/E below 20 (but have proven they can grow earnings).
To help readers see past the short term volatility of the financial market, we aim to bring you a long-term focused research analysis purely driven by fundamental data. Note that our analysis does not factor in the latest price-sensitive company announcements.
The author is an independent contributor and at the time of publication had no position in the stocks mentioned. For errors that warrant correction please contact the editor at editorial-team@simplywallst.com.
