Shell Midstream Partners LP (SHLX) Delivered A Better ROE Than The Industry, Here’s Why

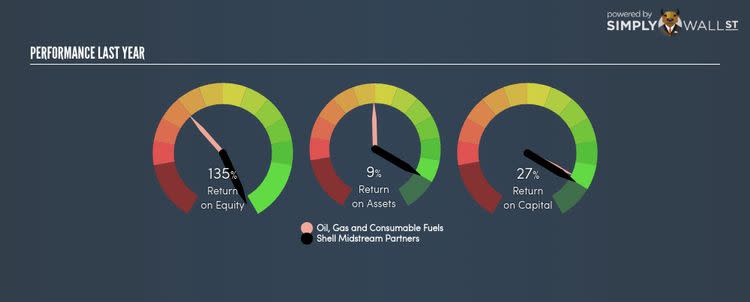
Shell Midstream Partners LP (NYSE:SHLX) outperformed the Oil and Gas Storage and Transportation industry on the basis of its ROE – producing a higher 135.42% relative to the peer average of 9.36% over the past 12 months. While the impressive ratio tells us that SHLX has made significant profits from little equity capital, ROE doesn’t tell us if SHLX has borrowed debt to make this happen. Today, we’ll take a closer look at some factors like financial leverage to see how sustainable SHLX’s ROE is. See our latest analysis for SHLX
What you must know about ROE
Firstly, Return on Equity, or ROE, is simply the percentage of last years’ earning against the book value of shareholders’ equity. An ROE of 135.42% implies $1.35 returned on every $1 invested. Generally speaking, a higher ROE is preferred; however, there are other factors we must also consider before making any conclusions.
Return on Equity = Net Profit ÷ Shareholders Equity
Returns are usually compared to costs to measure the efficiency of capital. SHLX’s cost of equity is 9.81%. This means SHLX returns enough to cover its own cost of equity, with a buffer of 125.61%. This sustainable practice implies that the company pays less for its capital than what it generates in return. ROE can be split up into three useful ratios: net profit margin, asset turnover, and financial leverage. This is called the Dupont Formula:
Dupont Formula
ROE = profit margin × asset turnover × financial leverage
ROE = (annual net profit ÷ sales) × (sales ÷ assets) × (assets ÷ shareholders’ equity)
ROE = annual net profit ÷ shareholders’ equity
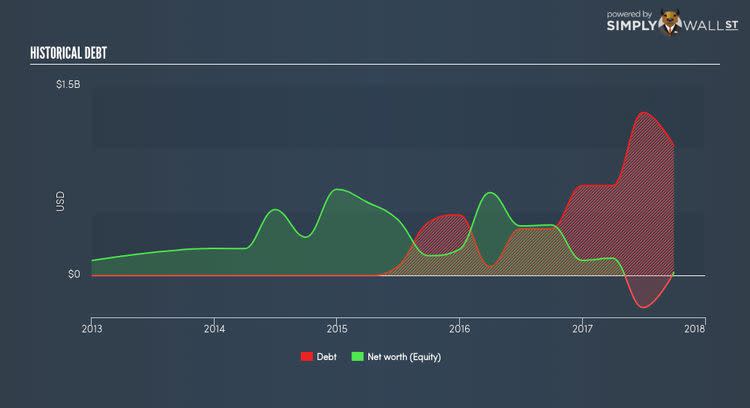
Basically, profit margin measures how much of revenue trickles down into earnings which illustrates how efficient SHLX is with its cost management. The other component, asset turnover, illustrates how much revenue SHLX can make from its asset base. And finally, financial leverage is simply how much of assets are funded by equity, which exhibits how sustainable SHLX’s capital structure is. Since ROE can be artificially increased through excessive borrowing, we should check SHLX’s historic debt-to-equity ratio. Currently the debt-to-equity ratio stands at more than 2.5 times, which means its above-average ROE is driven by significant debt levels.
What this means for you:
Are you a shareholder? SHLX’s ROE is impressive relative to the industry average and also covers its cost of equity. However, its high debt level appears to be the driver of a strong ROE and is something you should be mindful of before adding more of SHLX to your portfolio. If you’re looking for new ideas for high-returning stocks, you should take a look at our free platform to see the list of stocks with Return on Equity over 20%.
Are you a potential investor? If SHLX has been on your watch list for a while, making an investment decision based on ROE alone is unwise. I recommend you do additional fundamental analysis by looking through our most recent infographic report on Shell Midstream Partners to help you make a more informed investment decision.
To help readers see pass the short term volatility of the financial market, we aim to bring you a long-term focused research analysis purely driven by fundamental data. Note that our analysis does not factor in the latest price sensitive company announcements.
The author is an independent contributor and at the time of publication had no position in the stocks mentioned.
