Can Silver Chef Limited (ASX:SIV) Continue To Outperform Its Industry?

With an ROE of 13.76%, Silver Chef Limited (ASX:SIV) outpaced its own industry which delivered a less exciting 9.59% over the past year. While the impressive ratio tells us that SIV has made significant profits from little equity capital, ROE doesn’t tell us if SIV has borrowed debt to make this happen. Today, we’ll take a closer look at some factors like financial leverage to see how sustainable SIV’s ROE is. Check out our latest analysis for Silver Chef
Breaking down Return on Equity
Return on Equity (ROE) is a measure of SIV’s profit relative to its shareholders’ equity. An ROE of 13.76% implies $0.14 returned on every $1 invested. Generally speaking, a higher ROE is preferred; however, there are other factors we must also consider before making any conclusions.
Return on Equity = Net Profit ÷ Shareholders Equity
ROE is assessed against cost of equity, which is measured using the Capital Asset Pricing Model (CAPM) – but let’s not dive into the details of that today. For now, let’s just look at the cost of equity number for SIV, which is 14.85%. Since SIV’s return does not cover its cost, with a difference of -1.10%, this means its current use of equity is not efficient and not sustainable. Very simply, SIV pays more for its capital than what it generates in return. ROE can be broken down into three different ratios: net profit margin, asset turnover, and financial leverage. This is called the Dupont Formula:
Dupont Formula
ROE = profit margin × asset turnover × financial leverage
ROE = (annual net profit ÷ sales) × (sales ÷ assets) × (assets ÷ shareholders’ equity)
ROE = annual net profit ÷ shareholders’ equity

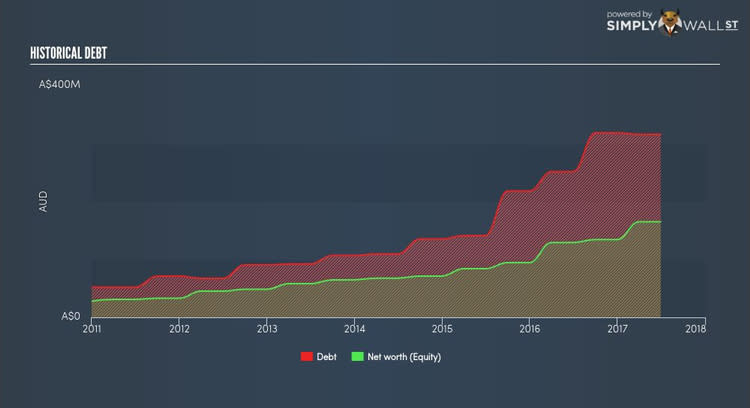
Basically, profit margin measures how much of revenue trickles down into earnings which illustrates how efficient SIV is with its cost management. Asset turnover reveals how much revenue can be generated from SIV’s asset base. And finally, financial leverage is simply how much of assets are funded by equity, which exhibits how sustainable SIV’s capital structure is. Since financial leverage can artificially inflate ROE, we need to look at how much debt SIV currently has. The debt-to-equity ratio currently stands at a high 191.25%, meaning the above-average ratio is a result of a large amount of debt.
What this means for you:
Are you a shareholder? SIV’s ROE is impressive relative to the industry average, though its returns were not strong enough to cover its own cost of equity. Additionally, its high debt level appears to be the driver of a strong ROE and is something you should be mindful of before adding more of SIV to your portfolio. If you’re looking for new ideas for high-returning stocks, you should take a look at our free platform to see the list of stocks with Return on Equity over 20%.
Are you a potential investor? If SIV has been on your watch list for a while, making an investment decision based on ROE alone is unwise. I recommend you do additional fundamental analysis by looking through our most recent infographic report on Silver Chef to help you make a more informed investment decision.
To help readers see pass the short term volatility of the financial market, we aim to bring you a long-term focused research analysis purely driven by fundamental data. Note that our analysis does not factor in the latest price sensitive company announcements.
The author is an independent contributor and at the time of publication had no position in the stocks mentioned.
