Skechers U.S.A., Inc.'s (NYSE:SKX) Stock Is Going Strong: Is the Market Following Fundamentals?
Skechers U.S.A (NYSE:SKX) has had a great run on the share market with its stock up by a significant 12% over the last month. Given the company's impressive performance, we decided to study its financial indicators more closely as a company's financial health over the long-term usually dictates market outcomes. Particularly, we will be paying attention to Skechers U.S.A's ROE today.
Return on Equity or ROE is a test of how effectively a company is growing its value and managing investors’ money. In short, ROE shows the profit each dollar generates with respect to its shareholder investments.
Check out our latest analysis for Skechers U.S.A
How To Calculate Return On Equity?
The formula for ROE is:
Return on Equity = Net Profit (from continuing operations) ÷ Shareholders' Equity
So, based on the above formula, the ROE for Skechers U.S.A is:
20% = US$759m ÷ US$3.7b (Based on the trailing twelve months to September 2022).
The 'return' is the yearly profit. So, this means that for every $1 of its shareholder's investments, the company generates a profit of $0.20.
Why Is ROE Important For Earnings Growth?
Thus far, we have learned that ROE measures how efficiently a company is generating its profits. Depending on how much of these profits the company reinvests or "retains", and how effectively it does so, we are then able to assess a company’s earnings growth potential. Generally speaking, other things being equal, firms with a high return on equity and profit retention, have a higher growth rate than firms that don’t share these attributes.
A Side By Side comparison of Skechers U.S.A's Earnings Growth And 20% ROE
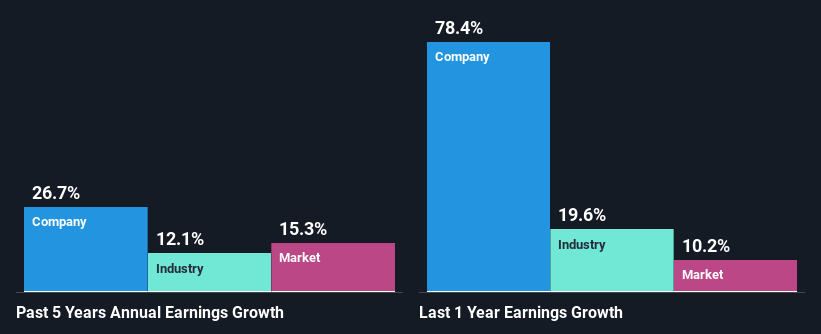
To begin with, Skechers U.S.A seems to have a respectable ROE. And on comparing with the industry, we found that the the average industry ROE is similar at 22%. This certainly adds some context to Skechers U.S.A's exceptional 27% net income growth seen over the past five years. However, there could also be other drivers behind this growth. For instance, the company has a low payout ratio or is being managed efficiently.
As a next step, we compared Skechers U.S.A's net income growth with the industry, and pleasingly, we found that the growth seen by the company is higher than the average industry growth of 12%.
Earnings growth is an important metric to consider when valuing a stock. The investor should try to establish if the expected growth or decline in earnings, whichever the case may be, is priced in. This then helps them determine if the stock is placed for a bright or bleak future. If you're wondering about Skechers U.S.A's's valuation, check out this gauge of its price-to-earnings ratio, as compared to its industry.
Is Skechers U.S.A Making Efficient Use Of Its Profits?
Given that Skechers U.S.A doesn't pay any dividend to its shareholders, we infer that the company has been reinvesting all of its profits to grow its business.
Conclusion
Overall, we are quite pleased with Skechers U.S.A's performance. Specifically, we like that the company is reinvesting a huge chunk of its profits at a high rate of return. This of course has caused the company to see substantial growth in its earnings. With that said, the latest industry analyst forecasts reveal that the company's earnings growth is expected to slow down. To know more about the latest analysts predictions for the company, check out this visualization of analyst forecasts for the company.
Have feedback on this article? Concerned about the content? Get in touch with us directly. Alternatively, email editorial-team (at) simplywallst.com.
This article by Simply Wall St is general in nature. We provide commentary based on historical data and analyst forecasts only using an unbiased methodology and our articles are not intended to be financial advice. It does not constitute a recommendation to buy or sell any stock, and does not take account of your objectives, or your financial situation. We aim to bring you long-term focused analysis driven by fundamental data. Note that our analysis may not factor in the latest price-sensitive company announcements or qualitative material. Simply Wall St has no position in any stocks mentioned.
Join A Paid User Research Session
You’ll receive a US$30 Amazon Gift card for 1 hour of your time while helping us build better investing tools for the individual investors like yourself. Sign up here
