A Sliding Share Price Has Us Looking At CarGurus, Inc.'s (NASDAQ:CARG) P/E Ratio

To the annoyance of some shareholders, CarGurus (NASDAQ:CARG) shares are down a considerable 30% in the last month. That drop has capped off a tough year for shareholders, with the share price down 55% in that time.
All else being equal, a share price drop should make a stock more attractive to potential investors. While the market sentiment towards a stock is very changeable, in the long run, the share price will tend to move in the same direction as earnings per share. The implication here is that long term investors have an opportunity when expectations of a company are too low. One way to gauge market expectations of a stock is to look at its Price to Earnings Ratio (PE Ratio). A high P/E implies that investors have high expectations of what a company can achieve compared to a company with a low P/E ratio.
Check out our latest analysis for CarGurus
Does CarGurus Have A Relatively High Or Low P/E For Its Industry?
We can tell from its P/E ratio of 46.14 that there is some investor optimism about CarGurus. You can see in the image below that the average P/E (19.7) for companies in the interactive media and services industry is lower than CarGurus's P/E.
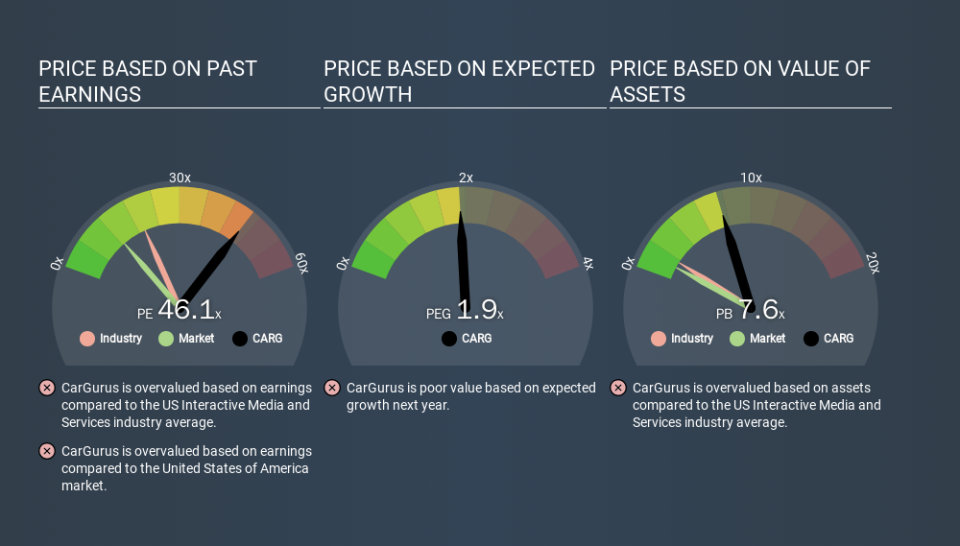
That means that the market expects CarGurus will outperform other companies in its industry. The market is optimistic about the future, but that doesn't guarantee future growth. So further research is always essential. I often monitor director buying and selling.
How Growth Rates Impact P/E Ratios
P/E ratios primarily reflect market expectations around earnings growth rates. That's because companies that grow earnings per share quickly will rapidly increase the 'E' in the equation. That means even if the current P/E is high, it will reduce over time if the share price stays flat. A lower P/E should indicate the stock is cheap relative to others -- and that may attract buyers.
CarGurus shrunk earnings per share by 37% over the last year.
Don't Forget: The P/E Does Not Account For Debt or Bank Deposits
One drawback of using a P/E ratio is that it considers market capitalization, but not the balance sheet. That means it doesn't take debt or cash into account. Hypothetically, a company could reduce its future P/E ratio by spending its cash (or taking on debt) to achieve higher earnings.
While growth expenditure doesn't always pay off, the point is that it is a good option to have; but one that the P/E ratio ignores.
CarGurus's Balance Sheet
CarGurus has net cash of US$172m. That should lead to a higher P/E than if it did have debt, because its strong balance sheets gives it more options.
The Verdict On CarGurus's P/E Ratio
CarGurus trades on a P/E ratio of 46.1, which is multiples above its market average of 12.7. The recent drop in earnings per share would make some investors cautious, but the relatively strong balance sheet will allow the company time to invest in growth. Clearly, the high P/E indicates shareholders think it will! What can be absolutely certain is that the market has become significantly less optimistic about CarGurus over the last month, with the P/E ratio falling from 66.2 back then to 46.1 today. For those who don't like to trade against momentum, that could be a warning sign, but a contrarian investor might want to take a closer look.
When the market is wrong about a stock, it gives savvy investors an opportunity. If the reality for a company is better than it expects, you can make money by buying and holding for the long term. So this free visualization of the analyst consensus on future earnings could help you make the right decision about whether to buy, sell, or hold.
But note: CarGurus may not be the best stock to buy. So take a peek at this free list of interesting companies with strong recent earnings growth (and a P/E ratio below 20).
If you spot an error that warrants correction, please contact the editor at editorial-team@simplywallst.com. This article by Simply Wall St is general in nature. It does not constitute a recommendation to buy or sell any stock, and does not take account of your objectives, or your financial situation. Simply Wall St has no position in the stocks mentioned.
We aim to bring you long-term focused research analysis driven by fundamental data. Note that our analysis may not factor in the latest price-sensitive company announcements or qualitative material. Thank you for reading.
