A Sliding Share Price Has Us Looking At Blue Bird Corporation's (NASDAQ:BLBD) P/E Ratio

To the annoyance of some shareholders, Blue Bird (NASDAQ:BLBD) shares are down a considerable 30% in the last month. The recent drop has obliterated the annual return, with the share price now down 13% over that longer period.
All else being equal, a share price drop should make a stock more attractive to potential investors. While the market sentiment towards a stock is very changeable, in the long run, the share price will tend to move in the same direction as earnings per share. So, on certain occasions, long term focussed investors try to take advantage of pessimistic expectations to buy shares at a better price. Perhaps the simplest way to get a read on investors' expectations of a business is to look at its Price to Earnings Ratio (PE Ratio). A high P/E ratio means that investors have a high expectation about future growth, while a low P/E ratio means they have low expectations about future growth.
Check out our latest analysis for Blue Bird
Does Blue Bird Have A Relatively High Or Low P/E For Its Industry?
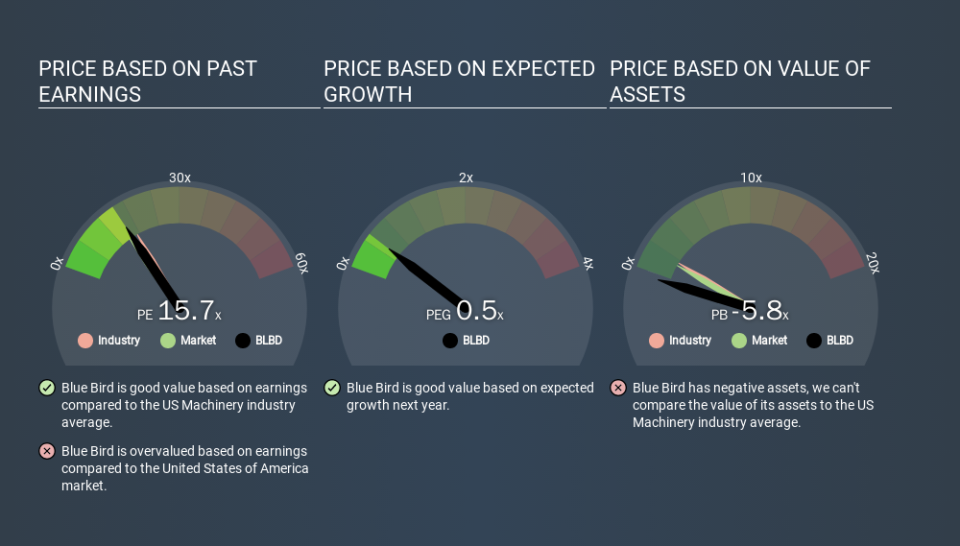
We can tell from its P/E ratio of 15.67 that sentiment around Blue Bird isn't particularly high. If you look at the image below, you can see Blue Bird has a lower P/E than the average (17.2) in the machinery industry classification.
Blue Bird's P/E tells us that market participants think it will not fare as well as its peers in the same industry. Many investors like to buy stocks when the market is pessimistic about their prospects. You should delve deeper. I like to check if company insiders have been buying or selling.
How Growth Rates Impact P/E Ratios
P/E ratios primarily reflect market expectations around earnings growth rates. If earnings are growing quickly, then the 'E' in the equation will increase faster than it would otherwise. Therefore, even if you pay a high multiple of earnings now, that multiple will become lower in the future. A lower P/E should indicate the stock is cheap relative to others -- and that may attract buyers.
Blue Bird saw earnings per share decrease by 32% last year.
Remember: P/E Ratios Don't Consider The Balance Sheet
Don't forget that the P/E ratio considers market capitalization. So it won't reflect the advantage of cash, or disadvantage of debt. Theoretically, a business can improve its earnings (and produce a lower P/E in the future) by investing in growth. That means taking on debt (or spending its cash).
While growth expenditure doesn't always pay off, the point is that it is a good option to have; but one that the P/E ratio ignores.
So What Does Blue Bird's Balance Sheet Tell Us?
Blue Bird's net debt is 52% of its market cap. This is enough debt that you'd have to make some adjustments before using the P/E ratio to compare it to a company with net cash.
The Verdict On Blue Bird's P/E Ratio
Blue Bird has a P/E of 15.7. That's around the same as the average in the US market, which is 14.7. With meaningful debt, and no earnings per share growth last year, even an average P/E indicates that the market a significant improvement from the business. What can be absolutely certain is that the market has become significantly less optimistic about Blue Bird over the last month, with the P/E ratio falling from 22.5 back then to 15.7 today. For those who don't like to trade against momentum, that could be a warning sign, but a contrarian investor might want to take a closer look.
Investors have an opportunity when market expectations about a stock are wrong. If the reality for a company is better than it expects, you can make money by buying and holding for the long term. So this free report on the analyst consensus forecasts could help you make a master move on this stock.
You might be able to find a better buy than Blue Bird. If you want a selection of possible winners, check out this free list of interesting companies that trade on a P/E below 20 (but have proven they can grow earnings).
If you spot an error that warrants correction, please contact the editor at editorial-team@simplywallst.com. This article by Simply Wall St is general in nature. It does not constitute a recommendation to buy or sell any stock, and does not take account of your objectives, or your financial situation. Simply Wall St has no position in the stocks mentioned.
We aim to bring you long-term focused research analysis driven by fundamental data. Note that our analysis may not factor in the latest price-sensitive company announcements or qualitative material. Thank you for reading.
