A Sliding Share Price Has Us Looking At The Hackett Group, Inc.'s (NASDAQ:HCKT) P/E Ratio

To the annoyance of some shareholders, Hackett Group (NASDAQ:HCKT) shares are down a considerable 36% in the last month. That drop has capped off a tough year for shareholders, with the share price down 40% in that time.
All else being equal, a share price drop should make a stock more attractive to potential investors. While the market sentiment towards a stock is very changeable, in the long run, the share price will tend to move in the same direction as earnings per share. The implication here is that long term investors have an opportunity when expectations of a company are too low. Perhaps the simplest way to get a read on investors' expectations of a business is to look at its Price to Earnings Ratio (PE Ratio). A high P/E implies that investors have high expectations of what a company can achieve compared to a company with a low P/E ratio.
See our latest analysis for Hackett Group
Does Hackett Group Have A Relatively High Or Low P/E For Its Industry?
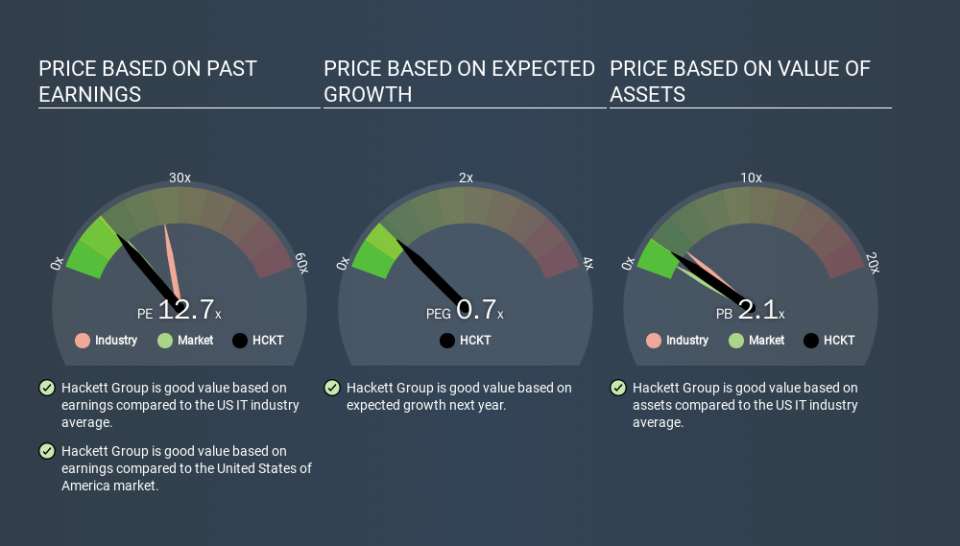
We can tell from its P/E ratio of 12.72 that sentiment around Hackett Group isn't particularly high. The image below shows that Hackett Group has a lower P/E than the average (24.2) P/E for companies in the it industry.
This suggests that market participants think Hackett Group will underperform other companies in its industry. While current expectations are low, the stock could be undervalued if the situation is better than the market assumes. It is arguably worth checking if insiders are buying shares, because that might imply they believe the stock is undervalued.
How Growth Rates Impact P/E Ratios
Earnings growth rates have a big influence on P/E ratios. When earnings grow, the 'E' increases, over time. And in that case, the P/E ratio itself will drop rather quickly. And as that P/E ratio drops, the company will look cheap, unless its share price increases.
Hackett Group saw earnings per share decrease by 16% last year. But EPS is up 18% over the last 5 years.
A Limitation: P/E Ratios Ignore Debt and Cash In The Bank
The 'Price' in P/E reflects the market capitalization of the company. Thus, the metric does not reflect cash or debt held by the company. The exact same company would hypothetically deserve a higher P/E ratio if it had a strong balance sheet, than if it had a weak one with lots of debt, because a cashed up company can spend on growth.
Such expenditure might be good or bad, in the long term, but the point here is that the balance sheet is not reflected by this ratio.
So What Does Hackett Group's Balance Sheet Tell Us?
Hackett Group has net cash of US$26m. That should lead to a higher P/E than if it did have debt, because its strong balance sheets gives it more options.
The Verdict On Hackett Group's P/E Ratio
Hackett Group trades on a P/E ratio of 12.7, which is fairly close to the US market average of 12.7. While the absence of growth in the last year is probably causing a degree of pessimism, the relatively strong balance sheet will allow the company to weather a storm; so it isn't very surprising to see that it has a P/E ratio close to the market average. What can be absolutely certain is that the market has become significantly less optimistic about Hackett Group over the last month, with the P/E ratio falling from 20.0 back then to 12.7 today. For those who prefer to invest with the flow of momentum, that might be a bad sign, but for a contrarian, it may signal opportunity.
Investors have an opportunity when market expectations about a stock are wrong. If the reality for a company is better than it expects, you can make money by buying and holding for the long term. So this free visualization of the analyst consensus on future earnings could help you make the right decision about whether to buy, sell, or hold.
You might be able to find a better buy than Hackett Group. If you want a selection of possible winners, check out this free list of interesting companies that trade on a P/E below 20 (but have proven they can grow earnings).
If you spot an error that warrants correction, please contact the editor at editorial-team@simplywallst.com. This article by Simply Wall St is general in nature. It does not constitute a recommendation to buy or sell any stock, and does not take account of your objectives, or your financial situation. Simply Wall St has no position in the stocks mentioned.
We aim to bring you long-term focused research analysis driven by fundamental data. Note that our analysis may not factor in the latest price-sensitive company announcements or qualitative material. Thank you for reading.
