A Sliding Share Price Has Us Looking At TFS Financial Corporation's (NASDAQ:TFSL) P/E Ratio

Unfortunately for some shareholders, the TFS Financial (NASDAQ:TFSL) share price has dived 33% in the last thirty days. The recent drop has obliterated the annual return, with the share price now down 12% over that longer period.
Assuming nothing else has changed, a lower share price makes a stock more attractive to potential buyers. In the long term, share prices tend to follow earnings per share, but in the short term prices bounce around in response to short term factors (which are not always obvious). The implication here is that long term investors have an opportunity when expectations of a company are too low. One way to gauge market expectations of a stock is to look at its Price to Earnings Ratio (PE Ratio). A high P/E implies that investors have high expectations of what a company can achieve compared to a company with a low P/E ratio.
See our latest analysis for TFS Financial
Does TFS Financial Have A Relatively High Or Low P/E For Its Industry?
TFS Financial's P/E of 47.59 indicates some degree of optimism towards the stock. The image below shows that TFS Financial has a significantly higher P/E than the average (10.4) P/E for companies in the mortgage industry.
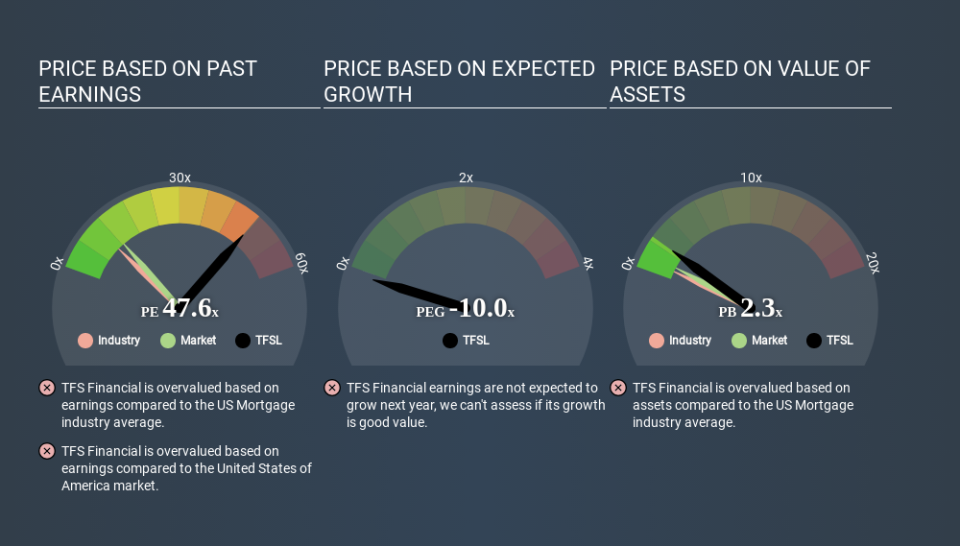
That means that the market expects TFS Financial will outperform other companies in its industry. Clearly the market expects growth, but it isn't guaranteed. So investors should always consider the P/E ratio alongside other factors, such as whether company directors have been buying shares.
How Growth Rates Impact P/E Ratios
Generally speaking the rate of earnings growth has a profound impact on a company's P/E multiple. Earnings growth means that in the future the 'E' will be higher. That means even if the current P/E is high, it will reduce over time if the share price stays flat. And as that P/E ratio drops, the company will look cheap, unless its share price increases.
TFS Financial had pretty flat EPS growth in the last year. But over the longer term (5 years) earnings per share have increased by 6.5%.
Don't Forget: The P/E Does Not Account For Debt or Bank Deposits
The 'Price' in P/E reflects the market capitalization of the company. In other words, it does not consider any debt or cash that the company may have on the balance sheet. Theoretically, a business can improve its earnings (and produce a lower P/E in the future) by investing in growth. That means taking on debt (or spending its cash).
While growth expenditure doesn't always pay off, the point is that it is a good option to have; but one that the P/E ratio ignores.
So What Does TFS Financial's Balance Sheet Tell Us?
TFS Financial has net debt worth 91% of its market capitalization. If you want to compare its P/E ratio to other companies, you should absolutely keep in mind it has significant borrowings.
The Verdict On TFS Financial's P/E Ratio
TFS Financial has a P/E of 47.6. That's significantly higher than the average in its market, which is 12.6. With significant debt and no EPS growth last year, shareholders are betting on an improvement in earnings from the company. What can be absolutely certain is that the market has become significantly less optimistic about TFS Financial over the last month, with the P/E ratio falling from 70.8 back then to 47.6 today. For those who don't like to trade against momentum, that could be a warning sign, but a contrarian investor might want to take a closer look.
Investors have an opportunity when market expectations about a stock are wrong. If the reality for a company is better than it expects, you can make money by buying and holding for the long term. So this free report on the analyst consensus forecasts could help you make a master move on this stock.
But note: TFS Financial may not be the best stock to buy. So take a peek at this free list of interesting companies with strong recent earnings growth (and a P/E ratio below 20).
If you spot an error that warrants correction, please contact the editor at editorial-team@simplywallst.com. This article by Simply Wall St is general in nature. It does not constitute a recommendation to buy or sell any stock, and does not take account of your objectives, or your financial situation. Simply Wall St has no position in the stocks mentioned.
We aim to bring you long-term focused research analysis driven by fundamental data. Note that our analysis may not factor in the latest price-sensitive company announcements or qualitative material. Thank you for reading.
