A Sliding Share Price Has Us Looking At Universal Display Corporation's (NASDAQ:OLED) P/E Ratio

To the annoyance of some shareholders, Universal Display (NASDAQ:OLED) shares are down a considerable 33% in the last month. The recent drop has obliterated the annual return, with the share price now down 25% over that longer period.
All else being equal, a share price drop should make a stock more attractive to potential investors. While the market sentiment towards a stock is very changeable, in the long run, the share price will tend to move in the same direction as earnings per share. So, on certain occasions, long term focussed investors try to take advantage of pessimistic expectations to buy shares at a better price. Perhaps the simplest way to get a read on investors' expectations of a business is to look at its Price to Earnings Ratio (PE Ratio). Investors have optimistic expectations of companies with higher P/E ratios, compared to companies with lower P/E ratios.
See our latest analysis for Universal Display
How Does Universal Display's P/E Ratio Compare To Its Peers?
Universal Display's P/E of 40.84 indicates some degree of optimism towards the stock. The image below shows that Universal Display has a higher P/E than the average (22.9) P/E for companies in the semiconductor industry.
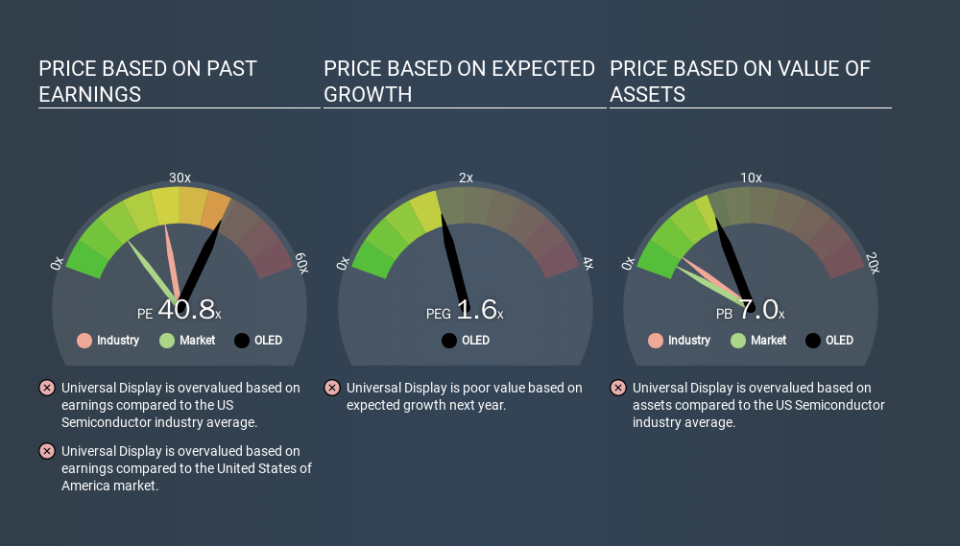
Universal Display's P/E tells us that market participants think the company will perform better than its industry peers, going forward. The market is optimistic about the future, but that doesn't guarantee future growth. So investors should always consider the P/E ratio alongside other factors, such as whether company directors have been buying shares.
How Growth Rates Impact P/E Ratios
Earnings growth rates have a big influence on P/E ratios. That's because companies that grow earnings per share quickly will rapidly increase the 'E' in the equation. Therefore, even if you pay a high multiple of earnings now, that multiple will become lower in the future. A lower P/E should indicate the stock is cheap relative to others -- and that may attract buyers.
In the last year, Universal Display grew EPS like Taylor Swift grew her fan base back in 2010; the 135% gain was both fast and well deserved. The sweetener is that the annual five year growth rate of 26% is also impressive. So I'd be surprised if the P/E ratio was not above average.
Don't Forget: The P/E Does Not Account For Debt or Bank Deposits
One drawback of using a P/E ratio is that it considers market capitalization, but not the balance sheet. Thus, the metric does not reflect cash or debt held by the company. Hypothetically, a company could reduce its future P/E ratio by spending its cash (or taking on debt) to achieve higher earnings.
Such spending might be good or bad, overall, but the key point here is that you need to look at debt to understand the P/E ratio in context.
How Does Universal Display's Debt Impact Its P/E Ratio?
With net cash of US$646m, Universal Display has a very strong balance sheet, which may be important for its business. Having said that, at 11% of its market capitalization the cash hoard would contribute towards a higher P/E ratio.
The Verdict On Universal Display's P/E Ratio
Universal Display's P/E is 40.8 which is way above average (12.7) in its market. Its net cash position is the cherry on top of its superb EPS growth. To us, this is the sort of company that we would expect to carry an above average price tag (relative to earnings). What can be absolutely certain is that the market has become significantly less optimistic about Universal Display over the last month, with the P/E ratio falling from 60.8 back then to 40.8 today. For those who don't like to trade against momentum, that could be a warning sign, but a contrarian investor might want to take a closer look.
When the market is wrong about a stock, it gives savvy investors an opportunity. If the reality for a company is better than it expects, you can make money by buying and holding for the long term. So this free visualization of the analyst consensus on future earnings could help you make the right decision about whether to buy, sell, or hold.
You might be able to find a better buy than Universal Display. If you want a selection of possible winners, check out this free list of interesting companies that trade on a P/E below 20 (but have proven they can grow earnings).
If you spot an error that warrants correction, please contact the editor at editorial-team@simplywallst.com. This article by Simply Wall St is general in nature. It does not constitute a recommendation to buy or sell any stock, and does not take account of your objectives, or your financial situation. Simply Wall St has no position in the stocks mentioned.
We aim to bring you long-term focused research analysis driven by fundamental data. Note that our analysis may not factor in the latest price-sensitive company announcements or qualitative material. Thank you for reading.
