SM Energy (SM) Up 9.5% Since Q3 Earnings Beat, Cuts Capex Plan
SM Energy Company SM stock jumped 9.5% since it reported better-than-expected third-quarter 2020 earnings on Oct 29. Moreover, it decreased full-year capital spending plan and increased production estimates from its guidance issued in July.
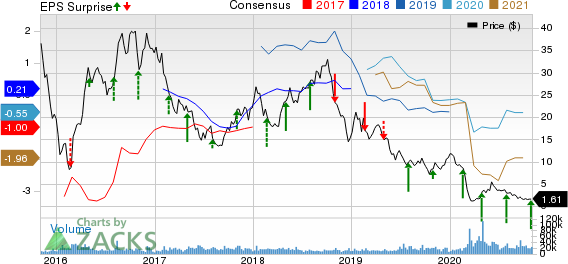
It announced adjusted loss of 5 cents per share, significantly narrower than the Zacks Consensus Estimate of a loss of 23 cents. Moreover, the reported figure improved from a loss of 11 cents a year ago.
Total revenues, which decreased to $281 million from $390.3 million in the prior-year quarter, missed the Zacks Consensus Estimate of $313 million.
The better-than-expected earnings can be attributed to lower operating expenses. The positives were partially offset by lower realized commodity prices and hydrocarbon production volumes.
SM Energy Company Price, Consensus and EPS Surprise

SM Energy Company price-consensus-eps-surprise-chart | SM Energy Company Quote
Operational Performance:
Total Production Falls
The company’s third-quarter production was 126.3 thousand barrels of oil equivalent per day (MBoe/d) (47.4% oil), down 6% from the year-ago level of 134.9 MBoe/d.
Oil production increased 2% year over year to 59.9 thousand barrels per day (MBbls/d). SM Energy produced 283.3 million cubic feet per day of natural gas for the quarter, down 12% year over year. Natural gas liquids contributed 19.2 MBbls/d to total production volume, down 15% from the third-quarter 2019 level.
Realized Prices Decline
Excluding the effects of derivative settlements, the average realized price per Boe was $24.28 compared with $31.39 in the year-ago quarter. Average realized price of natural gas fell 12% year over year to $1.90 per thousand cubic feet. Notably, average realized prices of oil decreased 30% to $37.69 per barrel and that of natural gas liquids declined 11% from the prior-year quarter to $14.07.
Cost & Expenses
On the cost front, unit lease operating expenses decreased 23% year over year to $3.65 per Boe. In addition, transportation expenses fell to $3.11 per Boe from $4 in the year-ago quarter. Moreover, general and administrative expenses decreased 20% to $2.10 per Boe from the prior-year level of $2.63.
Total exploration expenses were $8.5 million, lower than the year-ago figure of $11.6 million. Hydrocarbon production expenses for the quarter were recorded at $95.3 million compared with the year-ago level of $129 million. However, total operating expenses for the quarter increased to $384.1 million from the year-ago period’s $290.8 million, primarily due to substantial net derivative loss incurred.
Balance Sheet & Capex
As of Sep 30, SM Energy had a cash balance of only $10,000 and liquidity of $880 million. Its net long-term debt was $2,353 million, down from the second-quarter level of $2,456.1 million. The company had a debt to capitalization of 51.9%.
Capital expenditure for the quarter was recorded at $109.6 million, lower than the year-ago figure of $212.5 million. Notably, it generated free cash flow of $63.7 million in the quarter versus the year-ago negative free cash flow of $44.7 million.
Guidance
Due to current market volatility, it anticipates capital spending for full-year 2020 within $605-610 million. This expectation is 27% and 2% lower than its February and July guidance, respectively. The company expects production in the range of 123.5-126.2 Boe/d for the year, of which 49% will likely be crude oil. This represents a 2% decline from the guidance provided in February, but 2% rise from the July guidance. Fourth-quarter production will likely be in the range of 109-120 Mboe/d.
Lease operating expenses are expected to be $4 per Boe, reflecting a 26% decrease from the February guidance. Transportation expenses are anticipated in the range of $3.10-$3.30 per Boe, marking a 4% decline from the February view. The company now expects full-year exploration expense of $40 million, reflecting a 20% decrease from its February guidance.
The company has a strong hedging position, which enables it to navigate through the weak oil price environment. More than 90% of fourth-quarter crude oil volumes are currently hedged at more than $55 per barrel. Around 18,000 MBbls of 2021 oil production is hedged at about $40 per barrel.
Zacks Rank & Stocks to Consider
The company currently has a Zacks Rank #3 (Hold). Some better-ranked players in the energy space include Antero Midstream Corporation AM, Antero Resources Corporation AR and NuStar Energy L.P. NS, each holding a Zacks Rank #2 (Buy). You can see the complete list of today’s Zacks #1 Rank (Strong Buy) stocks here.
Antero Midstream’s bottom line for 2021 is expected to surge 403.2% year over year.
Antero Resources’ bottom line for 2021 is expected to rise 29.2% year over year.
NuStar Energy’s bottom line for 2021 is expected to rise 177.5% year over year.
The Hottest Tech Mega-Trend of All
Last year, it generated $24 billion in global revenues. By 2020, it's predicted to blast through the roof to $77.6 billion. Famed investor Mark Cuban says it will produce "the world's first trillionaires," but that should still leave plenty of money for regular investors who make the right trades early.
See Zacks' 3 Best Stocks to Play This Trend >>
Want the latest recommendations from Zacks Investment Research? Today, you can download 7 Best Stocks for the Next 30 Days. Click to get this free report
NuStar Energy L.P. (NS) : Free Stock Analysis Report
Antero Midstream Corporation (AM) : Free Stock Analysis Report
SM Energy Company (SM) : Free Stock Analysis Report
Antero Resources Corporation (AR) : Free Stock Analysis Report
To read this article on Zacks.com click here.
Zacks Investment Research
