Sohu (SOHU) Q2 Loss Narrows on Cost Control, Revenues Up Y/Y

Sohu.com Inc. SOHU reported second-quarter 2018 results wherein both the top and the bottom lines recorded improvement from the year-ago figures.
The company reported non-GAAP loss of $1.27 per share, which was much narrower than the year-ago quarter’s loss of $1.85. The figure was also better than management’s expectation of a loss between $1.40 and $1.65.
Sohu’s revenues of $486 million were up 5.4% year over year and came above the lower end of the guided range of $485–$510 million.
Management however appeared disappointed with the top-line performance, which was primarily attributable to the headwinds faced by the company’s brand advertising business. Nevertheless, they were optimistic about the cost stringent approach that positively impacted the bottom-line figure.
Quarter Details
Total online advertising revenues (inclusive of revenues from brand advertising, search and search related businesses) increased 21.6% year over year to $331.9 million.
Brand advertising revenues in the reported quarter however fell 28.5% on a year-over-year basis to $61.5 million, mainly due to decrease in portal and real estate advertising.
Search and search-related revenues increased 44.8% year over year to $270.4 million driven by growth in mobile search traffic and improved monetization.
Online game revenues of $94.3 million were down 23% from the year-ago quarter primarily due to “natural decline in revenue of Changyou's older games, including Legacy TLBB Mobile and Dao Jian Dou Shen Zhuan.”
Sohu Video revenues decreased 26% from the year-ago quarter to $32 million. Management is however optimistic about its original content and “lower spending on licensed content.”
Sohu Media Portal revenues fell 2% on a year-over-year basis to $43 million owing to intense competition in the online media industry. However, management stated that the company is focusing on increasing the user base of Sohu news application with an eye for “product design and content quality.”
Sogou’s SOGO revenues surged 43% year over year and 21% from the previous quarter to $301 million. Its core search revenue segment witnessed 45% year-over-year growth. The number of daily average users of Sogou Mobile Keyboard increased 36% from the year-ago period to $380 million.
Changyou’s CYOU revenues declined 25% year over year and 18% sequentially to $130 million.
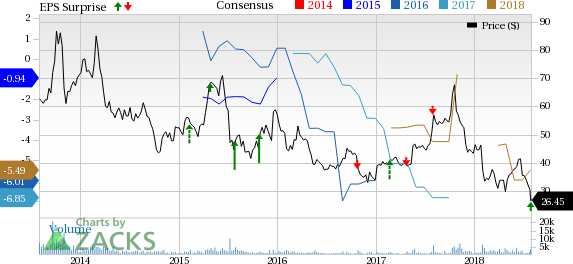
Sohu.com Inc. Price, Consensus and EPS Surprise
Sohu.com Inc. Price, Consensus and EPS Surprise | Sohu.com Inc. Quote
Margins
Non-GAAP gross margin in the quarter expanded 400 basis points (bps) on a year-over-year basis to 44%.
Non-GAAP gross margin of the company’s online advertising business was 35%, up from 19% in the prior-year quarter.
Brand advertising business margin was 23% against negative 45% in the year-ago quarter. Non-GAAP gross margin of the search and search-related business in the quarter contracted to 38% from the year-ago figure of 48%.
Non-GAAP gross margin of the online game business contracted 600 bps to 85% due to decline in Legacy TLBB game, which has high gross margin.
Sohu’s non-GAAP operating loss was $31 million compared with a loss of $27 million in the year-ago quarter.
Balance Sheet
Sohu exited the quarter with cash and cash equivalents (and short-term investments) of $1.89 billion compared with $3.31 billion as of Mar 31, 2018.
Outlook
For the third quarter of 2018, Sohu expects total revenues in the range of $445–$470 million.
Brand Advertising revenues are anticipated to be in the range of $60-$65 million, indicating a year-over-year decrease of 13-20%.
Online game revenues are expected in the band of $80-$90 million, marking a decline of 32-40% from the year-ago quarter.
Sogou revenues are projected to be in the range of $275-$285 million, indicating a year-over-year increase of 7-11%
Non-GAAP net loss is anticipated to be in the range of $55-$65 million. Non-GAAP loss per share is projected to be between $1.40 and $1.65.
Zacks Rank & Stock to Consider
Sohu.com currently carries a Zacks Rank #3 (Hold).
A better-ranked stock in the broader technology sector is Internet Initiative Japan, Inc. IIJI, sporting a Zacks Rank #1 (Strong Buy). You can see the complete list of today’s Zacks #1 Rank stocks here.
Long-term earnings growth rate for Internet Initiative Japan is projected to be 13.5%.
Today's Stocks from Zacks' Hottest Strategies
It's hard to believe, even for us at Zacks. But while the market gained +21.9% in 2017, our top stock-picking screens have returned +115.0%, +109.3%, +104.9%, +98.6%, and +67.1%.
And this outperformance has not just been a recent phenomenon. Over the years it has been remarkably consistent. From 2000 - 2017, the composite yearly average gain for these strategies has beaten the market more than 19X over. Maybe even more remarkable is the fact that we're willing to share their latest stocks with you without cost or obligation.
See Them Free>>
Want the latest recommendations from Zacks Investment Research? Today, you can download 7 Best Stocks for the Next 30 Days. Click to get this free report
Changyou.com Limited (CYOU) : Free Stock Analysis Report
Sohu.com Inc. (SOHU) : Free Stock Analysis Report
Internet Initiative Japan, Inc. (IIJI) : Free Stock Analysis Report
Sogou Inc. Sponsored ADR (SOGO) : Free Stock Analysis Report
To read this article on Zacks.com click here.
Zacks Investment Research
