Are Spark Energy, Inc.’s (NASDAQ:SPKE) High Returns Really That Great?

Today we'll evaluate Spark Energy, Inc. (NASDAQ:SPKE) to determine whether it could have potential as an investment idea. In particular, we'll consider its Return On Capital Employed (ROCE), as that can give us insight into how profitably the company is able to employ capital in its business.
Firstly, we'll go over how we calculate ROCE. Second, we'll look at its ROCE compared to similar companies. And finally, we'll look at how its current liabilities are impacting its ROCE.
Understanding Return On Capital Employed (ROCE)
ROCE measures the amount of pre-tax profits a company can generate from the capital employed in its business. In general, businesses with a higher ROCE are usually better quality. Overall, it is a valuable metric that has its flaws. Renowned investment researcher Michael Mauboussin has suggested that a high ROCE can indicate that 'one dollar invested in the company generates value of more than one dollar'.
So, How Do We Calculate ROCE?
The formula for calculating the return on capital employed is:
Return on Capital Employed = Earnings Before Interest and Tax (EBIT) ÷ (Total Assets - Current Liabilities)
Or for Spark Energy:
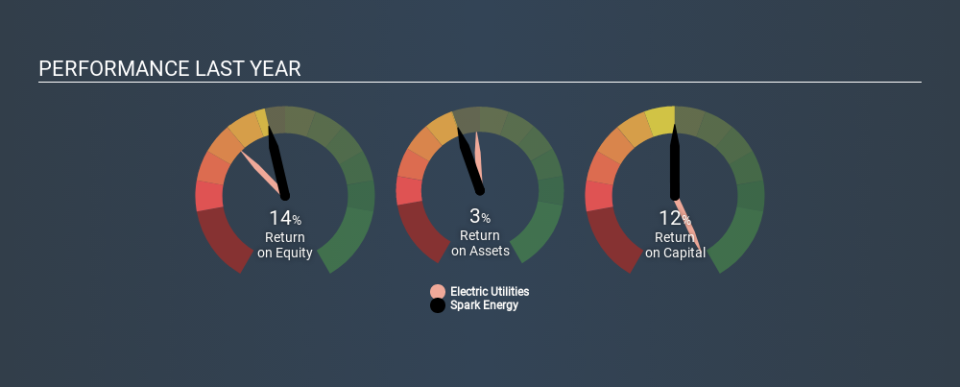
0.12 = US$30m ÷ (US$390m - US$138m) (Based on the trailing twelve months to March 2020.)
So, Spark Energy has an ROCE of 12%.
See our latest analysis for Spark Energy
Is Spark Energy's ROCE Good?
One way to assess ROCE is to compare similar companies. In our analysis, Spark Energy's ROCE is meaningfully higher than the 4.7% average in the Electric Utilities industry. We consider this a positive sign, because it suggests it uses capital more efficiently than similar companies. Separate from Spark Energy's performance relative to its industry, its ROCE in absolute terms looks satisfactory, and it may be worth researching in more depth.
Spark Energy's current ROCE of 12% is lower than 3 years ago, when the company reported a 35% ROCE. Therefore we wonder if the company is facing new headwinds. The image below shows how Spark Energy's ROCE compares to its industry, and you can click it to see more detail on its past growth.
When considering this metric, keep in mind that it is backwards looking, and not necessarily predictive. ROCE can be misleading for companies in cyclical industries, with returns looking impressive during the boom times, but very weak during the busts. ROCE is only a point-in-time measure. Since the future is so important for investors, you should check out our free report on analyst forecasts for Spark Energy.
How Spark Energy's Current Liabilities Impact Its ROCE
Liabilities, such as supplier bills and bank overdrafts, are referred to as current liabilities if they need to be paid within 12 months. Due to the way the ROCE equation works, having large bills due in the near term can make it look as though a company has less capital employed, and thus a higher ROCE than usual. To counteract this, we check if a company has high current liabilities, relative to its total assets.
Spark Energy has total assets of US$390m and current liabilities of US$138m. Therefore its current liabilities are equivalent to approximately 35% of its total assets. Spark Energy has a medium level of current liabilities, which would boost the ROCE.
What We Can Learn From Spark Energy's ROCE
Spark Energy's ROCE does look good, but the level of current liabilities also contribute to that. Spark Energy looks strong on this analysis, but there are plenty of other companies that could be a good opportunity . Here is a free list of companies growing earnings rapidly.
Spark Energy is not the only stock that insiders are buying. For those who like to find winning investments this free list of growing companies with recent insider purchasing, could be just the ticket.
Love or hate this article? Concerned about the content? Get in touch with us directly. Alternatively, email editorial-team@simplywallst.com.
This article by Simply Wall St is general in nature. It does not constitute a recommendation to buy or sell any stock, and does not take account of your objectives, or your financial situation. We aim to bring you long-term focused analysis driven by fundamental data. Note that our analysis may not factor in the latest price-sensitive company announcements or qualitative material. Simply Wall St has no position in any stocks mentioned. Thank you for reading.
