SQM (SQM) Crossed Above the 20-Day Moving Average: What That Means for Investors
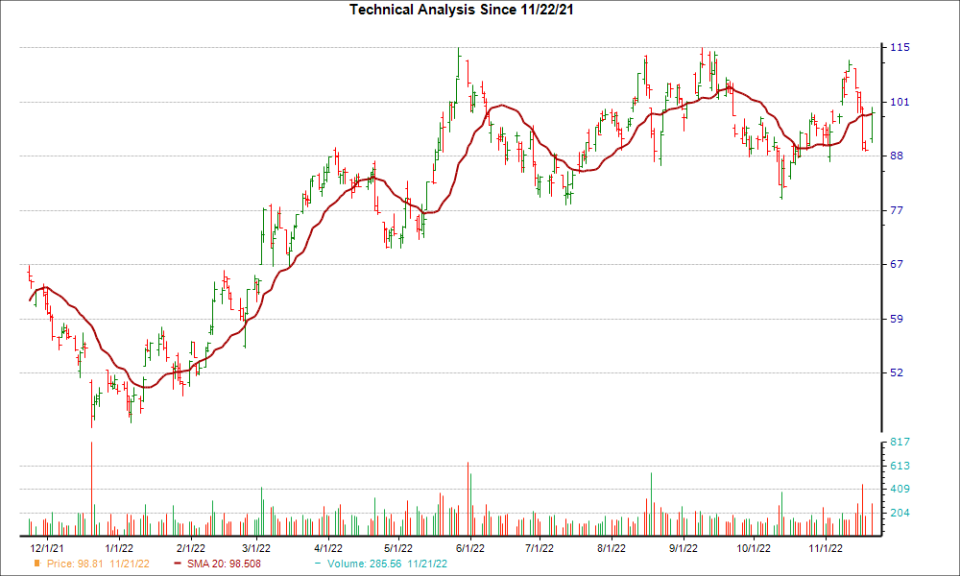
From a technical perspective, SQM (SQM) is looking like an interesting pick, as it just reached a key level of support. SQM recently overtook the 20-day moving average, and this suggests a short-term bullish trend.
A well-liked tool among traders, the 20-day simple moving average offers a look back at a stock's price over a 20-day period. This is very beneficial to short-term traders, as it smooths out short-term price trends and gives more trend reversal signals than longer-term moving averages.
Like other SMAs, if a stock's price is moving above the 20-day, the trend is considered positive. When the price falls below the moving average, it can signal a downward trend.
SQM could be on the verge of another rally after moving 6.7% higher over the last four weeks. Plus, the company is currently a Zacks Rank #1 (Strong Buy) stock.
The bullish case solidifies once investors consider SQM's positive earnings estimate revisions. No estimate has gone lower in the past two months for the current fiscal year, compared to 2 higher, while the consensus estimate has increased too.
With a winning combination of earnings estimate revisions and hitting a key technical level, investors should keep their eye on SQM for more gains in the near future.
Want the latest recommendations from Zacks Investment Research? Today, you can download 7 Best Stocks for the Next 30 Days. Click to get this free report
Sociedad Quimica y Minera S.A. (SQM) : Free Stock Analysis Report
To read this article on Zacks.com click here.
