AT&T Inc (NYSE:T) Delivered A Better ROE Than The Industry, Here’s Why

AT&T Inc (NYSE:T) delivered an ROE of 10.55% over the past 12 months, which is an impressive feat relative to its industry average of 10.21% during the same period. On the surface, this looks fantastic since we know that T has made large profits from little equity capital; however, ROE doesn’t tell us if management have borrowed heavily to make this happen. We’ll take a closer look today at factors like financial leverage to determine whether T’s ROE is actually sustainable. View our latest analysis for AT&T
What you must know about ROE
Return on Equity (ROE) is a measure of AT&T’s profit relative to its shareholders’ equity. It essentially shows how much the company can generate in earnings given the amount of equity it has raised. While a higher ROE is preferred in most cases, there are several other factors we should consider before drawing any conclusions.
Return on Equity = Net Profit ÷ Shareholders Equity
Returns are usually compared to costs to measure the efficiency of capital. AT&T’s cost of equity is 8.49%. This means AT&T returns enough to cover its own cost of equity, with a buffer of 2.06%. This sustainable practice implies that the company pays less for its capital than what it generates in return. ROE can be dissected into three distinct ratios: net profit margin, asset turnover, and financial leverage. This is called the Dupont Formula:
Dupont Formula
ROE = profit margin × asset turnover × financial leverage
ROE = (annual net profit ÷ sales) × (sales ÷ assets) × (assets ÷ shareholders’ equity)
ROE = annual net profit ÷ shareholders’ equity

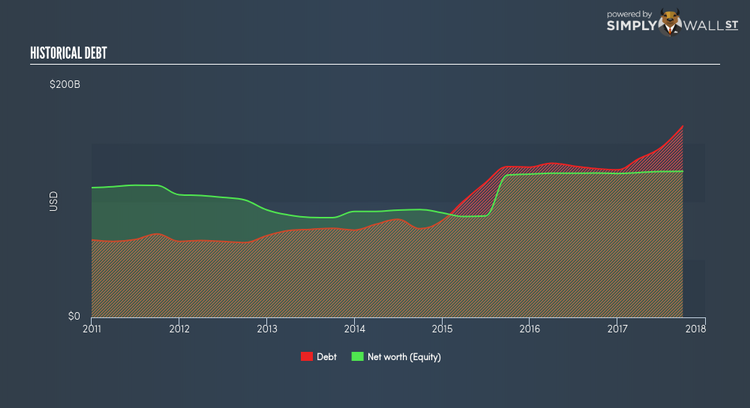
Essentially, profit margin shows how much money the company makes after paying for all its expenses. The other component, asset turnover, illustrates how much revenue AT&T can make from its asset base. The most interesting ratio, and reflective of sustainability of its ROE, is financial leverage. Since financial leverage can artificially inflate ROE, we need to look at how much debt AT&T currently has. The debt-to-equity ratio currently stands at a balanced 130.94%, meaning the above-average ROE is due to its capacity to produce profit growth without a huge debt burden.
What this means for you:
Are you a shareholder? T exhibits a strong ROE against its peers, as well as sufficient returns to cover its cost of equity. Since its high ROE is not likely driven by high debt, it might be a good time to top up on your current holdings if your fundamental research reaffirms this analysis. If you’re looking for new ideas for high-returning stocks, you should take a look at our free platform to see the list of stocks with Return on Equity over 20%.
Are you a potential investor? If T has been on your watch list for a while, making an investment decision based on ROE alone is unwise. I recommend you do additional fundamental analysis by looking through our most recent infographic report on AT&T to help you make a more informed investment decision.
To help readers see pass the short term volatility of the financial market, we aim to bring you a long-term focused research analysis purely driven by fundamental data. Note that our analysis does not factor in the latest price sensitive company announcements.
The author is an independent contributor and at the time of publication had no position in the stocks mentioned.
