Here’s What Tamarack Valley Energy Ltd’s (TSE:TVE) Return On Capital Can Tell Us

Today we'll look at Tamarack Valley Energy Ltd (TSE:TVE) and reflect on its potential as an investment. Specifically, we're going to calculate its Return On Capital Employed (ROCE), in the hopes of getting some insight into the business.
Firstly, we'll go over how we calculate ROCE. Next, we'll compare it to others in its industry. Last but not least, we'll look at what impact its current liabilities have on its ROCE.
Return On Capital Employed (ROCE): What is it?
ROCE is a measure of a company's yearly pre-tax profit (its return), relative to the capital employed in the business. All else being equal, a better business will have a higher ROCE. Overall, it is a valuable metric that has its flaws. Author Edwin Whiting says to be careful when comparing the ROCE of different businesses, since 'No two businesses are exactly alike.'
How Do You Calculate Return On Capital Employed?
The formula for calculating the return on capital employed is:
Return on Capital Employed = Earnings Before Interest and Tax (EBIT) ÷ (Total Assets - Current Liabilities)
Or for Tamarack Valley Energy:
0.05 = CA$65m ÷ (CA$1.3b - CA$45m) (Based on the trailing twelve months to June 2019.)
Therefore, Tamarack Valley Energy has an ROCE of 5.0%.
See our latest analysis for Tamarack Valley Energy
Does Tamarack Valley Energy Have A Good ROCE?
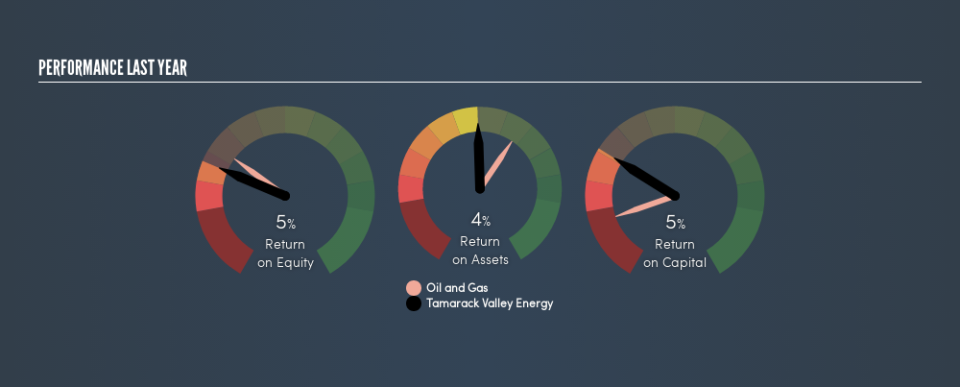
ROCE is commonly used for comparing the performance of similar businesses. We can see Tamarack Valley Energy's ROCE is around the 5.7% average reported by the Oil and Gas industry. Separate from how Tamarack Valley Energy stacks up against its industry, its ROCE in absolute terms is mediocre; relative to the returns on government bonds. Investors may wish to consider higher-performing investments.
Tamarack Valley Energy delivered an ROCE of 5.0%, which is better than 3 years ago, as was making losses back then. That suggests the business has returned to profitability. You can click on the image below to see (in greater detail) how Tamarack Valley Energy's past growth compares to other companies.
It is important to remember that ROCE shows past performance, and is not necessarily predictive. ROCE can be deceptive for cyclical businesses, as returns can look incredible in boom times, and terribly low in downturns. This is because ROCE only looks at one year, instead of considering returns across a whole cycle. Remember that most companies like Tamarack Valley Energy are cyclical businesses. Future performance is what matters, and you can see analyst predictions in our free report on analyst forecasts for the company.
How Tamarack Valley Energy's Current Liabilities Impact Its ROCE
Current liabilities include invoices, such as supplier payments, short-term debt, or a tax bill, that need to be paid within 12 months. Due to the way ROCE is calculated, a high level of current liabilities makes a company look as though it has less capital employed, and thus can (sometimes unfairly) boost the ROCE. To check the impact of this, we calculate if a company has high current liabilities relative to its total assets.
Tamarack Valley Energy has total liabilities of CA$45m and total assets of CA$1.3b. As a result, its current liabilities are equal to approximately 3.4% of its total assets. Tamarack Valley Energy reports few current liabilities, which have a negligible impact on its unremarkable ROCE.
Our Take On Tamarack Valley Energy's ROCE
Tamarack Valley Energy looks like an ok business, but on this analysis it is not at the top of our buy list. But note: make sure you look for a great company, not just the first idea you come across. So take a peek at this free list of interesting companies with strong recent earnings growth (and a P/E ratio below 20).
If you like to buy stocks alongside management, then you might just love this free list of companies. (Hint: insiders have been buying them).
We aim to bring you long-term focused research analysis driven by fundamental data. Note that our analysis may not factor in the latest price-sensitive company announcements or qualitative material.
If you spot an error that warrants correction, please contact the editor at editorial-team@simplywallst.com. This article by Simply Wall St is general in nature. It does not constitute a recommendation to buy or sell any stock, and does not take account of your objectives, or your financial situation. Simply Wall St has no position in the stocks mentioned. Thank you for reading.
