Is Targa Resources Corp’s (NYSE:TRGP) Balance Sheet Strong Enough To Weather A Storm?

There are a number of reasons that attract investors towards large-cap companies such as Targa Resources Corp (NYSE:TRGP), with a market cap of US$10.85b. Doing business globally, large caps tend to have diversified revenue streams and attractive capital returns, making them desirable investments for risk-averse portfolios. However, the health of the financials determines whether the company continues to succeed. Today we will look at Targa Resources’s financial liquidity and debt levels, which are strong indicators for whether the company can weather economic downturns or fund strategic acquisitions for future growth. Remember this is a very top-level look that focuses exclusively on financial health, so I recommend a deeper analysis into TRGP here. Check out our latest analysis for Targa Resources
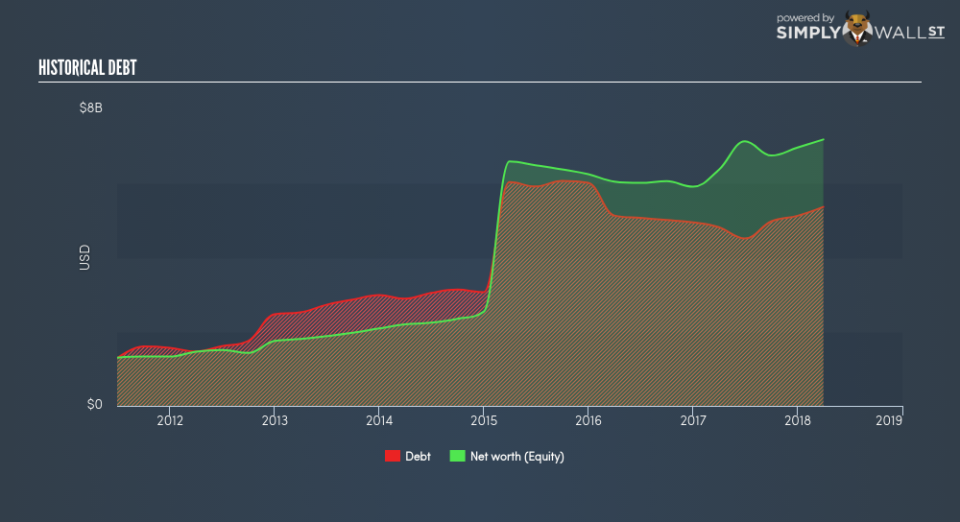
Does TRGP produce enough cash relative to debt?
TRGP’s debt level has been constant at around US$5.13b over the previous year – this includes both the current and long-term debt. At this constant level of debt, the current cash and short-term investment levels stands at US$137.20m , ready to deploy into the business. Additionally, TRGP has produced US$939.50m in operating cash flow in the last twelve months, resulting in an operating cash to total debt ratio of 18.32%, indicating that TRGP’s operating cash is not sufficient to cover its debt. This ratio can also be a sign of operational efficiency as an alternative to return on assets. In TRGP’s case, it is able to generate 0.18x cash from its debt capital.
Can TRGP meet its short-term obligations with the cash in hand?
At the current liabilities level of US$1.62b liabilities, it seems that the business is not able to meet these obligations given the level of current assets of US$1.27b, with a current ratio of 0.79x below the prudent level of 3x.
Does TRGP face the risk of succumbing to its debt-load?
With debt reaching 74.69% of equity, TRGP may be thought of as relatively highly levered. This is not unusual for large-caps since debt tends to be less expensive than equity because interest payments are tax deductible. Accordingly, large companies often have lower cost of capital due to easily obtained financing, providing an advantage over smaller companies. By measuring how many times TRGP’s earnings can cover interest payments, we can evaluate whether its level of debt is sustainable or not. Ideally, earnings before interest and tax (EBIT) should cover net interest by at least three times. In TRGP’s case, the ratio of 1.88x suggests that interest is not strongly covered. Given the sheer size of Targa Resources, it’s unlikely to default on interest payments and enter bankruptcy. However, compared to an amply profitable large-cap peer, debtors may see more risk in lending to TRGP.
Next Steps:
TRGP’s debt and cash flow levels indicate room for improvement. Its cash flow coverage of less than a quarter of debt means that operating efficiency could be an issue. Furthermore, its lack of liquidity raises questions over current asset management practices for the large-cap. This is only a rough assessment of financial health, and I’m sure TRGP has company-specific issues impacting its capital structure decisions. I suggest you continue to research Targa Resources to get a better picture of the stock by looking at:
Future Outlook: What are well-informed industry analysts predicting for TRGP’s future growth? Take a look at our free research report of analyst consensus for TRGP’s outlook.
Valuation: What is TRGP worth today? Is the stock undervalued, even when its growth outlook is factored into its intrinsic value? The intrinsic value infographic in our free research report helps visualize whether TRGP is currently mispriced by the market.
Other High-Performing Stocks: Are there other stocks that provide better prospects with proven track records? Explore our free list of these great stocks here.
To help readers see pass the short term volatility of the financial market, we aim to bring you a long-term focused research analysis purely driven by fundamental data. Note that our analysis does not factor in the latest price sensitive company announcements.
The author is an independent contributor and at the time of publication had no position in the stocks mentioned.
