How Do Tarsus Group plc’s (LON:TRS) Returns Compare To Its Industry?

Today we are going to look at Tarsus Group plc (LON:TRS) to see whether it might be an attractive investment prospect. Specifically, we’re going to calculate its Return On Capital Employed (ROCE), in the hopes of getting some insight into the business.
First, we’ll go over how we calculate ROCE. Next, we’ll compare it to others in its industry. And finally, we’ll look at how its current liabilities are impacting its ROCE.
What is Return On Capital Employed (ROCE)?
ROCE measures the ‘return’ (pre-tax profit) a company generates from capital employed in its business. All else being equal, a better business will have a higher ROCE. In brief, it is a useful tool, but it is not without drawbacks. Renowned investment researcher Michael Mauboussin has suggested that a high ROCE can indicate that ‘one dollar invested in the company generates value of more than one dollar’.
How Do You Calculate Return On Capital Employed?
The formula for calculating the return on capital employed is:
Return on Capital Employed = Earnings Before Interest and Tax (EBIT) ÷ (Total Assets – Current Liabilities)
Or for Tarsus Group:
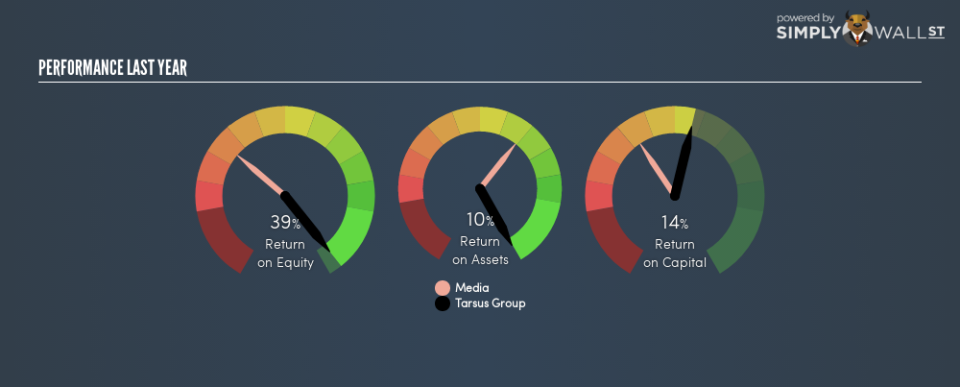
0.14 = UK£30m ÷ (UK£288m – UK£71m) (Based on the trailing twelve months to June 2018.)
So, Tarsus Group has an ROCE of 14%.
Check out our latest analysis for Tarsus Group
Want to help shape the future of investing tools and platforms? Take the survey and be part of one of the most advanced studies of stock market investors to date.
Is Tarsus Group’s ROCE Good?
ROCE is commonly used for comparing the performance of similar businesses. Tarsus Group’s ROCE appears to be substantially greater than the 9.4% average in the Media industry. We consider this a positive sign, because it suggests it uses capital more efficiently than similar companies. Independently of how Tarsus Group compares to its industry, its ROCE in absolute terms appears decent, and the company may be worthy of closer investigation.
As we can see, Tarsus Group currently has an ROCE of 14% compared to its ROCE 3 years ago, which was 8.0%. This makes us think about whether the company has been reinvesting shrewdly.
When considering this metric, keep in mind that it is backwards looking, and not necessarily predictive. ROCE can be deceptive for cyclical businesses, as returns can look incredible in boom times, and terribly low in downturns. This is because ROCE only looks at one year, instead of considering returns across a whole cycle. Since the future is so important for investors, you should check out our free report on analyst forecasts for Tarsus Group.
What Are Current Liabilities, And How Do They Affect Tarsus Group’s ROCE?
Current liabilities are short term bills and invoices that need to be paid in 12 months or less. Due to the way ROCE is calculated, a high level of current liabilities makes a company look as though it has less capital employed, and thus can (sometimes unfairly) boost the ROCE. To counteract this, we check if a company has high current liabilities, relative to its total assets.
Tarsus Group has total liabilities of UK£71m and total assets of UK£288m. As a result, its current liabilities are equal to approximately 25% of its total assets. Low current liabilities are not boosting the ROCE too much.
What We Can Learn From Tarsus Group’s ROCE
Overall, Tarsus Group has a decent ROCE and could be worthy of further research. Of course you might be able to find a better stock than Tarsus Group. So you may wish to see this free collection of other companies that have grown earnings strongly.
For those who like to find winning investments this free list of growing companies with recent insider purchasing, could be just the ticket.
To help readers see past the short term volatility of the financial market, we aim to bring you a long-term focused research analysis purely driven by fundamental data. Note that our analysis does not factor in the latest price-sensitive company announcements.
The author is an independent contributor and at the time of publication had no position in the stocks mentioned. For errors that warrant correction please contact the editor at editorial-team@simplywallst.com.
