Taubman Centers (TCO) Q2 FFO and Revenues Lag Estimates
Taubman Centers Inc. TCO reported second-quarter 2020 adjusted funds from operations (AFFO) per share of 41 cents, missing the Zacks Consensus Estimate of 64 cents. The figure also declined 56.4% from the year-ago quarter’s reported number of 94 cents.
The pandemic-led interruptions, including widespread center closures during most of the second quarter, hindered results. In fact, the closure of properties negatively impacted lease cancellation income and sales-based rent.
Adjusted revenues (consisting of rental revenues, overage rents, and revenues from management, leasing, and development services for consolidated businesses) were $113.8 million, lagging the Zacks Consensus Estimate of $143 million. Moreover, the reported figure slid from $149.6 million reported in second-quarter 2019.
Quarter in Detail
Comparable center net operating income at the company’s beneficial interest (excluding lease cancellation income and using constant foreign exchange rates) declined 25.3% year over year.
Trailing 12-month sales per square foot in the United States was $866. Also, average rent per square foot in U.S. comparable centers for the quarter was $60.35; marking a 5.9% decrease from the year-ago period’s $64.13. In Asia, sales per square foot improved 4.3% in the second quarter.
As of Jun 30, 2020, leased space in U.S. comparable centers was 93.8%, down 1.1% from Jun 30, 2019. Additionally, ending occupancy in U.S. comparable centers of 91.5% was down 0.3% year over year at the end of the reported quarter.
Liquidity
Taubman Centers exited second-quarter 2020 with consolidated cash of $241 million and $119 million available on its lines of credit.
In March, the company borrowed $350 million on its $1.1-billion primary unsecured revolving line of credit to boost its liquidity and improve financial flexibility. In late June, Taubman Centers repaid $100 million, reducing the outstanding balance to $870 million as of the second-quarter end.
Taubman Centers carries a Zacks Rank #5 (Strong Sell) at present.
You can see the complete list of today’s Zacks #1 Rank (Strong Buy) stocks here.
Taubman Centers, Inc. Price, Consensus and EPS Surprise
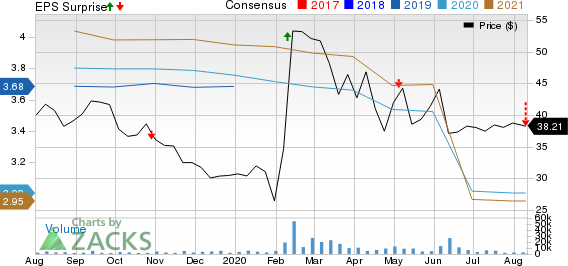
Taubman Centers, Inc. price-consensus-eps-surprise-chart | Taubman Centers, Inc. Quote
Performance of Other REITs
American Tower Corporation AMT reported second-quarter 2020 FFO per share of $2.07, beating the Zacks Consensus Estimate of $2.05. Further, the reported figure improved 1.5% year over year.
Host Hotels & Resorts, Inc. HST reported second-quarter 2020 loss in terms of adjusted FFO per share of 26 cents, meeting the Zacks Consensus Estimate. Notably, the company reported adjusted FFO per share of 53 cents in the prior-year quarter.
SL Green Realty Corp. SLG reported second-quarter 2020 FFO per share of $1.70, surpassing the Zacks Consensus Estimate of $1.55. The figure, however, compares unfavorably with the year-ago quarter’s $1.82.
Note: Anything related to earnings presented in this write-up represents funds from operations (FFO) — a widely used metric to gauge the performance of REITs.
Zacks’ Single Best Pick to Double
From thousands of stocks, 5 Zacks experts each picked their favorite to gain +100% or more in months to come. From those 5, Zacks Director of Research, Sheraz Mian hand-picks one to have the most explosive upside of all.
With users in 180 countries and soaring revenues, it’s set to thrive on remote working long after the pandemic ends. No wonder it recently offered a stunning $600 million stock buy-back plan.
The sky’s the limit for this emerging tech giant. And the earlier you get in, the greater your potential gain.
Click Here, See It Free >>
Want the latest recommendations from Zacks Investment Research? Today, you can download 7 Best Stocks for the Next 30 Days. Click to get this free report
American Tower Corporation REIT (AMT) : Free Stock Analysis Report
Taubman Centers, Inc. (TCO) : Free Stock Analysis Report
Host Hotels Resorts, Inc. (HST) : Free Stock Analysis Report
SL Green Realty Corporation (SLG) : Free Stock Analysis Report
To read this article on Zacks.com click here.
Zacks Investment Research
