Technical Update For Gold, Silver & WTI Crude Oil: 20.07.2018
GOLD
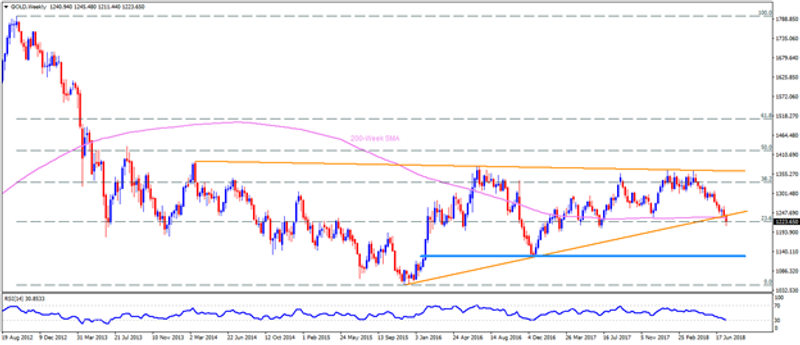
In addition to its break of an upward slanting trend-line ranging since late-2015, the Gold also dipped beneath the 200-week SMA, which in-turn signal brighter chances of its further downturn to $1200 round-figure if prices close below $1234-40 region including aforementioned catalysts. Should the sellers refrain to respect the $1200 mark, the $1193, the $1168 and the $1142 are likely following stops they can avail before visiting the $1125-30 support-zone. On the contrary, a weekly close beyond or within the $1234-40 area may trigger the metal’s recovery to $1270 and then to the $1283 resistances. However, there are multiple barriers for the Bullion between $1300 and the $1310 that may challenge the Buyers’ strength past-$1283.
SILVER
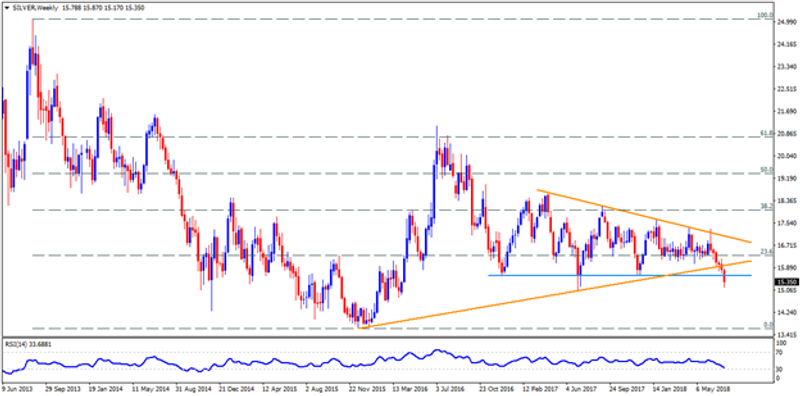
Not only Gold, the Silver also broke important support on the weekly chart, i.e. $15.60-65 horizontal-line. As a result, the Bullion seems well inclined to revisit the $15.00 support, breaking which $14.60 and the $14.25 can please the Bears. Given the quote’s sustained decline below $14.25, chances of its plunge to $14.00 and the $13.60 can’t be denied. Meanwhile, $15.60 and the $16.00 may entertain counter-trend traders prior to questioning them with $16.15 hurdle to north. In case the white-metal keep rising above $16.15, the $16.75, the $16.90 and the descending TL figure of $17.10 may appear in the Bulls’ radar to target.
WTI Crude Oil
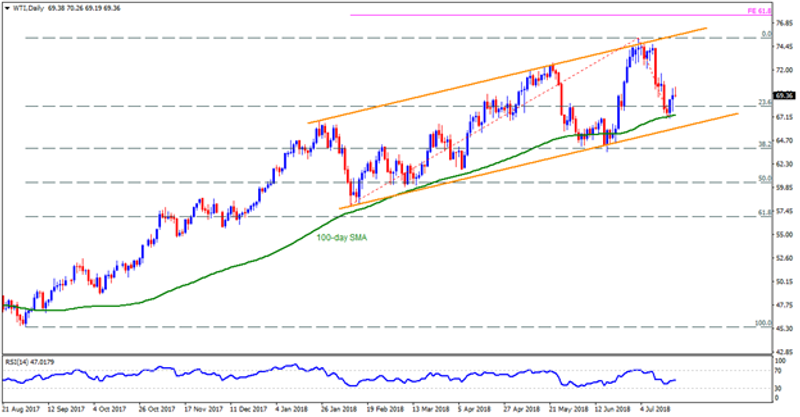
Following its U-turn from 100-day SMA, WTI Crude oil is expectedly running towards $70.80 and the $71.60 if it manages to close above $70.30 on a daily closing basis. During the Crude’s upside post-$71.60, the $72.60 and the $73.50 can offer intermediate halts ahead of directing market attention to the $74.60 and the $75.35-55 area that includes recent high and resistance-line of an ascending trend-channel. Alternatively, the $68.50 and the 100-day SMA level of $67.35 can mark their presence on the chart during the quote’s pullback whereas channel-support figure of $65.85 may limit its extended downside. Assuming that the energy prices close below $65.85, the $64.30, the $63.50 and the $62.80 might be highlighted.
This article was originally posted on FX Empire
