Should You Be Tempted To Buy Enbridge Income Fund Holdings Inc (TSE:ENF) Because Of Its PE Ratio?

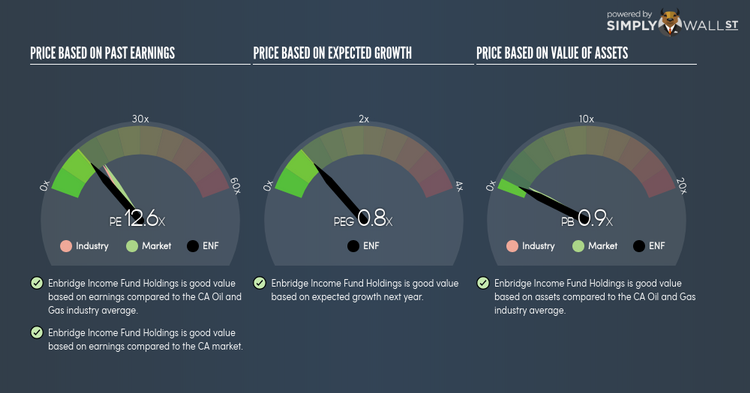
Enbridge Income Fund Holdings Inc (TSX:ENF) is trading with a trailing P/E of 12.6x, which is lower than the industry average of 15.4x. While ENF might seem like an attractive stock to buy, it is important to understand the assumptions behind the P/E ratio before you make any investment decisions. In this article, I will explain what the P/E ratio is as well as what you should look out for when using it. Check out our latest analysis for Enbridge Income Fund Holdings
Breaking down the Price-Earnings ratio
P/E is often used for relative valuation since earnings power is a chief driver of investment value. By comparing a stock’s price per share to its earnings per share, we are able to see how much investors are paying for each dollar of the company’s earnings.
P/E Calculation for ENF
Price-Earnings Ratio = Price per share ÷ Earnings per share
ENF Price-Earnings Ratio = CA$27.15 ÷ CA$2.162 = 12.6x
On its own, the P/E ratio doesn’t tell you much; however, it becomes extremely useful when you compare it with other similar companies. Our goal is to compare the stock’s P/E ratio to the average of companies that have similar attributes to ENF, such as company lifetime and products sold. A common peer group is companies that exist in the same industry, which is what I use. Since ENF’s P/E of 12.6x is lower than its industry peers (15.4x), it means that investors are paying less than they should for each dollar of ENF’s earnings. As such, our analysis shows that ENF represents an under-priced stock.
Assumptions to watch out for
Before you jump to the conclusion that ENF is the perfect buying opportunity, it is important to realise that our conclusion rests on two assertions. Firstly, our peer group contains companies that are similar to ENF. If this isn’t the case, the difference in P/E could be due to other factors. For example, if you are comparing lower risk firms with ENF, then its P/E would naturally be lower than its peers, as investors would value those with lower risk at a higher price. The second assumption that must hold true is that the stocks we are comparing ENF to are fairly valued by the market. If this is violated, ENF’s P/E may be lower than its peers as they are actually overvalued by investors.
To help readers see pass the short term volatility of the financial market, we aim to bring you a long-term focused research analysis purely driven by fundamental data. Note that our analysis does not factor in the latest price sensitive company announcements.
The author is an independent contributor and at the time of publication had no position in the stocks mentioned.
