Should You Be Tempted To Buy Hennessy Advisors Inc (NASDAQ:HNNA) Because Of Its PE Ratio?

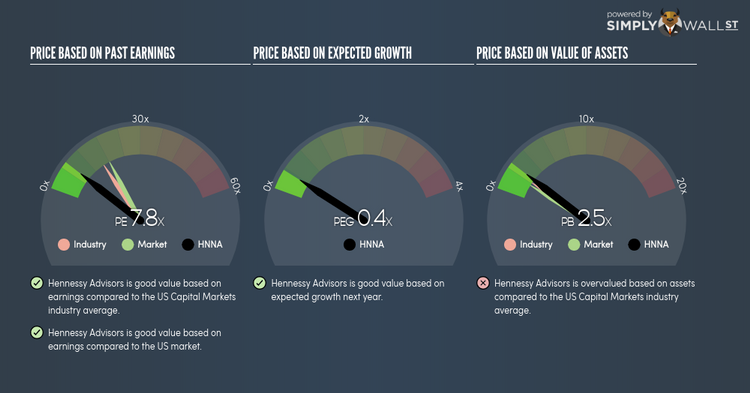
Hennessy Advisors Inc (NASDAQ:HNNA) trades with a trailing P/E of 7.8x, which is lower than the industry average of 15.7x. While this makes HNNA appear like a great stock to buy, you might change your mind after I explain the assumptions behind the P/E ratio. In this article, I will explain what the P/E ratio is as well as what you should look out for when using it. Check out our latest analysis for Hennessy Advisors
Breaking down the P/E ratio
The P/E ratio is one of many ratios used in relative valuation. It compares a stock’s price per share to the stock’s earnings per share. A more intuitive way of understanding the P/E ratio is to think of it as how much investors are paying for each dollar of the company’s earnings.
P/E Calculation for HNNA
Price-Earnings Ratio = Price per share ÷ Earnings per share
HNNA Price-Earnings Ratio = $19.3 ÷ $2.478 = 7.8x
The P/E ratio itself doesn’t tell you a lot; however, it becomes very insightful when you compare it with other similar companies. We want to compare the stock’s P/E ratio to the average of companies that have similar characteristics as HNNA, such as size and country of operation. One way of gathering a peer group is to use firms in the same industry, which is what I’ll do. At 7.8x, HNNA’s P/E is lower than its industry peers (15.7x). This implies that investors are undervaluing each dollar of HNNA’s earnings. Therefore, according to this analysis, HNNA is an under-priced stock.
Assumptions to watch out for
However, before you rush out to buy HNNA, it is important to note that this conclusion is based on two key assumptions. The first is that our “similar companies” are actually similar to HNNA, or else the difference in P/E might be a result of other factors. For example, if you compared higher growth firms with HNNA, then its P/E would naturally be lower since investors would reward its peers’ higher growth with a higher price. The second assumption that must hold true is that the stocks we are comparing HNNA to are fairly valued by the market. If this does not hold true, HNNA’s lower P/E ratio may be because firms in our peer group are overvalued by the market.
To help readers see pass the short term volatility of the financial market, we aim to bring you a long-term focused research analysis purely driven by fundamental data. Note that our analysis does not factor in the latest price sensitive company announcements.
The author is an independent contributor and at the time of publication had no position in the stocks mentioned.
