Should You Be Tempted To Sell Alm. Brand A/S (CPH:ALMB) Because Of Its P/E Ratio?

Today, we'll introduce the concept of the P/E ratio for those who are learning about investing. We'll show how you can use Alm. Brand A/S's (CPH:ALMB) P/E ratio to inform your assessment of the investment opportunity. Based on the last twelve months, Alm. Brand's P/E ratio is 17.64. That means that at current prices, buyers pay DKK17.64 for every DKK1 in trailing yearly profits.
See our latest analysis for Alm. Brand
How Do I Calculate A Price To Earnings Ratio?
The formula for price to earnings is:
Price to Earnings Ratio = Price per Share ÷ Earnings per Share (EPS)
Or for Alm. Brand:
P/E of 17.64 = DKK54.90 ÷ DKK3.11 (Based on the trailing twelve months to September 2019.)
Is A High P/E Ratio Good?
A higher P/E ratio means that buyers have to pay a higher price for each DKK1 the company has earned over the last year. That is not a good or a bad thing per se, but a high P/E does imply buyers are optimistic about the future.
Does Alm. Brand Have A Relatively High Or Low P/E For Its Industry?
We can get an indication of market expectations by looking at the P/E ratio. The image below shows that Alm. Brand has a higher P/E than the average (12.1) P/E for companies in the insurance industry.
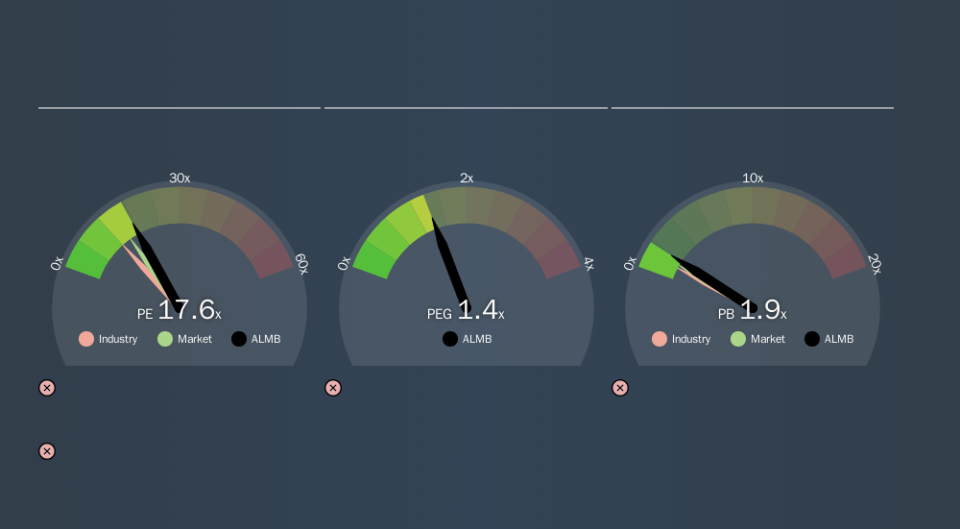
That means that the market expects Alm. Brand will outperform other companies in its industry. Clearly the market expects growth, but it isn't guaranteed. So investors should delve deeper. I like to check if company insiders have been buying or selling.
How Growth Rates Impact P/E Ratios
When earnings fall, the 'E' decreases, over time. Therefore, even if you pay a low multiple of earnings now, that multiple will become higher in the future. A higher P/E should indicate the stock is expensive relative to others -- and that may encourage shareholders to sell.
Alm. Brand's earnings per share fell by 20% in the last twelve months. But over the longer term (5 years) earnings per share have increased by 19%. And over the longer term (3 years) earnings per share have decreased 12% annually. This growth rate might warrant a low P/E ratio.
A Limitation: P/E Ratios Ignore Debt and Cash In The Bank
The 'Price' in P/E reflects the market capitalization of the company. In other words, it does not consider any debt or cash that the company may have on the balance sheet. Theoretically, a business can improve its earnings (and produce a lower P/E in the future) by investing in growth. That means taking on debt (or spending its cash).
Such spending might be good or bad, overall, but the key point here is that you need to look at debt to understand the P/E ratio in context.
Is Debt Impacting Alm. Brand's P/E?
Net debt totals just 9.2% of Alm. Brand's market cap. So it doesn't have as many options as it would with net cash, but its debt would not have much of an impact on its P/E ratio.
The Verdict On Alm. Brand's P/E Ratio
Alm. Brand's P/E is 17.6 which is above average (14.9) in its market. With some debt but no EPS growth last year, the market has high expectations of future profits.
Investors should be looking to buy stocks that the market is wrong about. If the reality for a company is better than it expects, you can make money by buying and holding for the long term. So this free report on the analyst consensus forecasts could help you make a master move on this stock.
But note: Alm. Brand may not be the best stock to buy. So take a peek at this free list of interesting companies with strong recent earnings growth (and a P/E ratio below 20).
If you spot an error that warrants correction, please contact the editor at editorial-team@simplywallst.com. This article by Simply Wall St is general in nature. It does not constitute a recommendation to buy or sell any stock, and does not take account of your objectives, or your financial situation. Simply Wall St has no position in the stocks mentioned.
We aim to bring you long-term focused research analysis driven by fundamental data. Note that our analysis may not factor in the latest price-sensitive company announcements or qualitative material. Thank you for reading.
