Should You Be Tempted To Sell ATS Automation Tooling Systems Inc. (TSE:ATA) Because Of Its P/E Ratio?

This article is written for those who want to get better at using price to earnings ratios (P/E ratios). To keep it practical, we'll show how ATS Automation Tooling Systems Inc.'s (TSE:ATA) P/E ratio could help you assess the value on offer. Looking at earnings over the last twelve months, ATS Automation Tooling Systems has a P/E ratio of 24.99. That corresponds to an earnings yield of approximately 4.0%.
Check out our latest analysis for ATS Automation Tooling Systems
How Do You Calculate A P/E Ratio?
The formula for price to earnings is:
Price to Earnings Ratio = Share Price ÷ Earnings per Share (EPS)
Or for ATS Automation Tooling Systems:
P/E of 24.99 = CAD21.36 ÷ CAD0.85 (Based on the year to September 2019.)
Is A High Price-to-Earnings Ratio Good?
A higher P/E ratio means that buyers have to pay a higher price for each CAD1 the company has earned over the last year. All else being equal, it's better to pay a low price -- but as Warren Buffett said, 'It's far better to buy a wonderful company at a fair price than a fair company at a wonderful price'.
How Does ATS Automation Tooling Systems's P/E Ratio Compare To Its Peers?
One good way to get a quick read on what market participants expect of a company is to look at its P/E ratio. The image below shows that ATS Automation Tooling Systems has a higher P/E than the average (22.9) P/E for companies in the machinery industry.
That means that the market expects ATS Automation Tooling Systems will outperform other companies in its industry. Shareholders are clearly optimistic, but the future is always uncertain. So investors should delve deeper. I like to check if company insiders have been buying or selling.
How Growth Rates Impact P/E Ratios
Generally speaking the rate of earnings growth has a profound impact on a company's P/E multiple. Earnings growth means that in the future the 'E' will be higher. Therefore, even if you pay a high multiple of earnings now, that multiple will become lower in the future. A lower P/E should indicate the stock is cheap relative to others -- and that may attract buyers.
In the last year, ATS Automation Tooling Systems grew EPS like Taylor Swift grew her fan base back in 2010; the 63% gain was both fast and well deserved. And earnings per share have improved by 28% annually, over the last three years. So we'd absolutely expect it to have a relatively high P/E ratio.
Remember: P/E Ratios Don't Consider The Balance Sheet
The 'Price' in P/E reflects the market capitalization of the company. In other words, it does not consider any debt or cash that the company may have on the balance sheet. Theoretically, a business can improve its earnings (and produce a lower P/E in the future) by investing in growth. That means taking on debt (or spending its cash).
Such spending might be good or bad, overall, but the key point here is that you need to look at debt to understand the P/E ratio in context.
Is Debt Impacting ATS Automation Tooling Systems's P/E?
Net debt totals just 7.1% of ATS Automation Tooling Systems's market cap. So it doesn't have as many options as it would with net cash, but its debt would not have much of an impact on its P/E ratio.
The Bottom Line On ATS Automation Tooling Systems's P/E Ratio
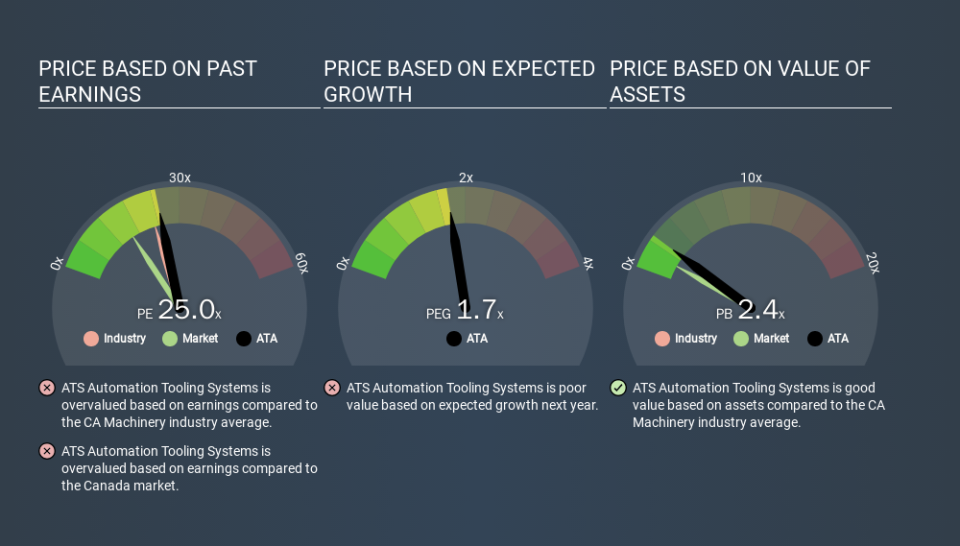
ATS Automation Tooling Systems's P/E is 25.0 which is above average (15.8) in its market. While the company does use modest debt, its recent earnings growth is superb. So on this analysis a high P/E ratio seems reasonable.
Investors should be looking to buy stocks that the market is wrong about. People often underestimate remarkable growth -- so investors can make money when fast growth is not fully appreciated. So this free report on the analyst consensus forecasts could help you make a master move on this stock.
But note: ATS Automation Tooling Systems may not be the best stock to buy. So take a peek at this free list of interesting companies with strong recent earnings growth (and a P/E ratio below 20).
If you spot an error that warrants correction, please contact the editor at editorial-team@simplywallst.com. This article by Simply Wall St is general in nature. It does not constitute a recommendation to buy or sell any stock, and does not take account of your objectives, or your financial situation. Simply Wall St has no position in the stocks mentioned.
We aim to bring you long-term focused research analysis driven by fundamental data. Note that our analysis may not factor in the latest price-sensitive company announcements or qualitative material. Thank you for reading.
